


We’re uploading new templates every week
We’d like to send you infrequent emails with brief updates to let you know of the latest free templates. Is that okay?

Reset your Password
Please enter the email you registered with and we will send you a link to reset your password!
Check your email!
We’ve just sent you a link to . Please follow instructions from our email.


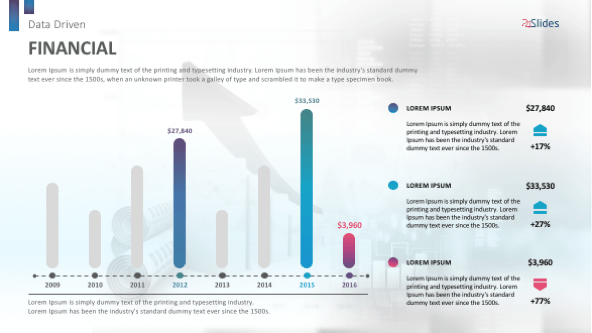
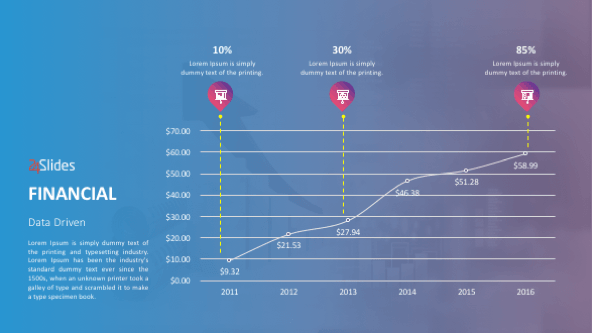
Another template from our Data Driven Collection. In order for the data to be presented in a meaningful way, we recommend that you use different charts and graphs. Those are a great alternative for giving the learners a lot of information at a quick glance. This template can be easily adapted to your specific data sets and aesthetic needs. You can easily update them in Excel by just right clicking on the graph and by selecting ‘Edit data in…’.
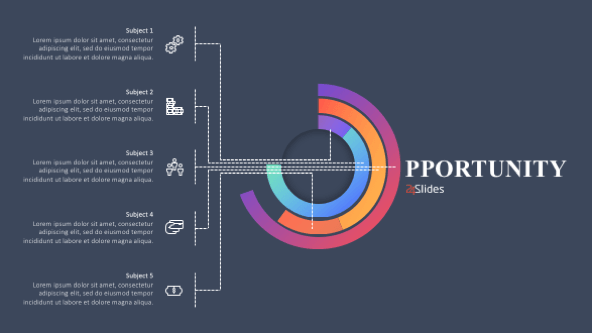
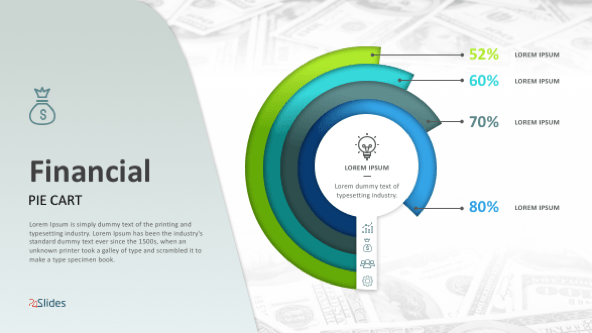
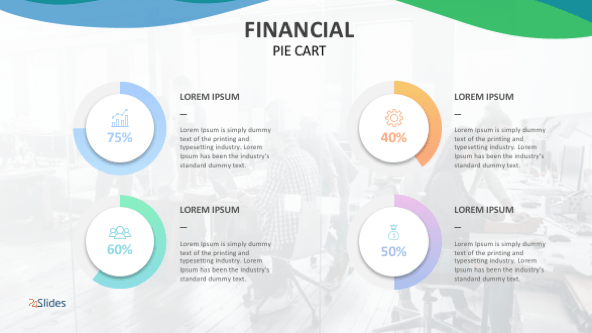
Start the presentation with a convenient pie chart. Show your audience the different metrics and KPIs of the company and how they affect its overall development. You can easily show numerical proportions where each slice of the pie will represent a proportional quantity of the whole. Based on the underlying data, you will create powerful stories to tell to your audience. The template will enable you to provide an easy-to-follow framework for planning the data of different projects.
Another great alternative for data driven presentation is the area chart. It is based on the line chart and allows for presenting graphically quantitative data. You can show multiple data series that have part-to- whole relationships or use it for a cumulative series of values. In addition to depicting a time-series relationship, the area visually represents volume.
When presenting relevant data, it is important to know your audience and what exactly they want to hear. You can make a successful data selection with this template and find creative solutions for the possible issues that may arise. Also, you can present the possible outliers that your data might have. These will enable you to tell an interesting story, because such details usually surprise and fascinate the audience.
You can provide an easy-to-follow framework for planning the data sets
A professional and simple template for a successful presentation of all of the critical issues.
Pie charts and area charts for a convenient presentation
There is nothing more visual and convincing than graphs that encompass all of the business’s highlights.
A template that will create a powerful story from your multiple data series
High visualization of the business’s data is the key to successful storytelling.


FIND OUT MORE ABOUT OUR CUSTOM DESIGN SERVICES
Check out other similar templates

 69 fully
editable
slides
69 fully
editable
slides

Todd Speranzo
VP of Marketing at Avella
"24Slides helps us get PowerPoints on-brand, and improve overall design in a timeframe that is often “overnight”. Leveraging the time zone change and their deep understanding of PowerPoint, our Marketing team has a partner in 24Slides that allows us to focus purely on slide content, leaving all of the design work to 24Slides."
Gretchen Ponts
Strata Research
"The key to the success with working with 24Slides has been the designers’ ability to revamp basic information on a slide into a dynamic yet clean and clear visual presentation coupled with the speed in which they do so. We do not work in an environment where time is on our side and the visual presentation is everything. In those regards, 24Slides has been invaluable."
Nyah Pham
Novozymes
"After training and testing, 24Slides quickly learnt how to implement our CVI, deliver at a high quality and provide a dedicated design team that always tries to accommodate our wishes in terms of design and deadlines."