


Great slides, delivered to your inbox
Join thousands of professionals who get our best presentation tips, new templates, and design inspiration from the 24Slides team. Plus, if you ever need a fully custom deck — we’ll be a click away.

Reset your Password
Please enter the email you registered with and we will send you a link to reset your password!
Check your email!
We’ve just sent you a link to . Please follow instructions from our email.


Getting a good understanding of your performance as a team or as a business is essential in improving your processes and delivering the best solutions on the market. Modern technology allows for complex data gathering and processing, and this presentation pack is exceptional for showcasing your reports in a stimulating and engaging manner. This modern and professional slide pack helps you deliver a memorable presentation. Highlight your focus points with the metric description slides, compare metrics with the category performance slide, and look at your operations at a high level with the region comparison slide.
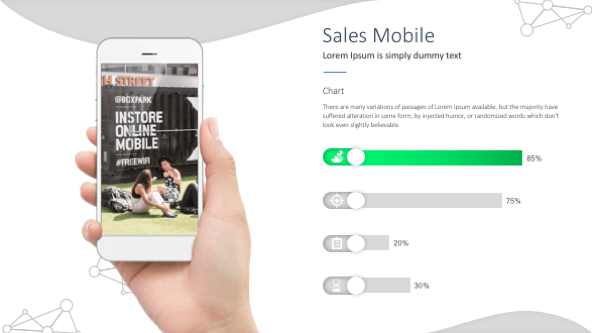
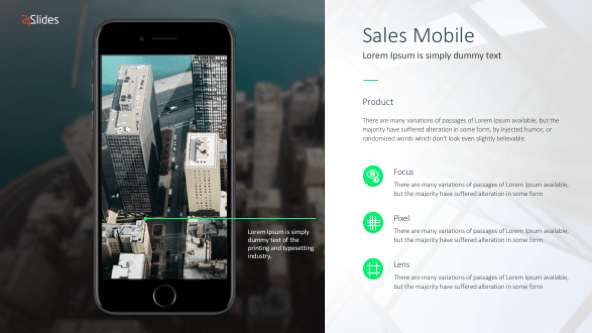
Whether you’re looking at sales, operation costs, project progress or other types of data, you need to inform your stakeholders about the points tackled in the presentation from the beginning in order to clarify any potential uncertainties. Provide a short description for each alongside a representative icon.
See how different categories are performing over time with respect to each other. Identify events which prompted changes in the numbers, such as a brand refresh, a new marking campaign, the launch of a product, an issue with existing services.
Especially with globally operated businesses, comparing how your organization performs across different areas of the world can offer invaluable insights. Whether the dedicated teams are adopting different solutions or it’s a social-economic factor involved, identifying the cause for better performance in one area over the other can lead to better results.
Data is meaningless without interpretation
Focus on the essential metrics and deliver a punchy and memorable presentation
Interpretations presented badly are a waste of resources
Be clear and concise in your presentations, don’t focus on irrelevant information
Engaging presentations stimulate productivity
Following a meeting with a specific agenda, employees can work more efficiently with a clear goal in mind


FIND OUT MORE ABOUT OUR CUSTOM DESIGN SERVICES
Check out other similar templates

 69 fully
editable
slides
69 fully
editable
slides
Todd Speranzo
VP of Marketing at Avella
"24Slides helps us get PowerPoints on-brand, and improve overall design in a timeframe that is often “overnight”. Leveraging the time zone change and their deep understanding of PowerPoint, our Marketing team has a partner in 24Slides that allows us to focus purely on slide content, leaving all of the design work to 24Slides."
Gretchen Ponts
Strata Research
"The key to the success with working with 24Slides has been the designers’ ability to revamp basic information on a slide into a dynamic yet clean and clear visual presentation coupled with the speed in which they do so. We do not work in an environment where time is on our side and the visual presentation is everything. In those regards, 24Slides has been invaluable."
Nyah Pham
Novozymes
"After training and testing, 24Slides quickly learnt how to implement our CVI, deliver at a high quality and provide a dedicated design team that always tries to accommodate our wishes in terms of design and deadlines."