
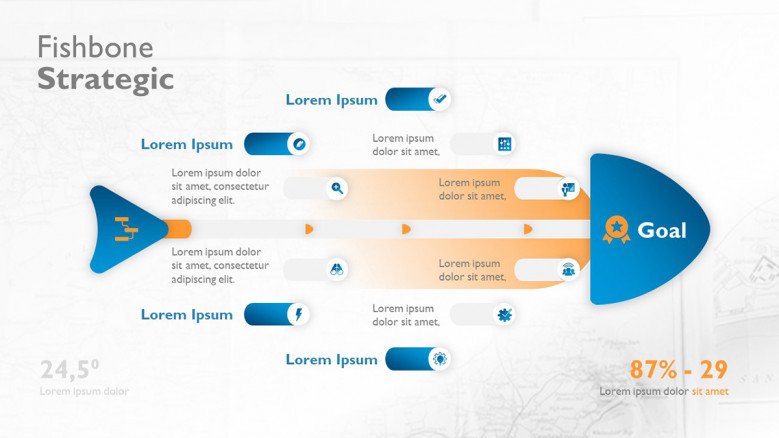
The Fishbone Diagram, also known as the Ishikawa Diagram, is one of the most powerful cause-and-effect analysis tools. When something goes wrong, you need to get to the root cause in order to resolve the problem. That’s exactly what the Fishbone Diagram is perfect for! Track down the possible causes of failures in a process, project, or initiative with this easy to use visual tool. Just place the effect or problem at the head of the fishbone diagram and the potential causes into the spine. You’ll get a holistic view of the issue and a clear notion on how to resolve it.
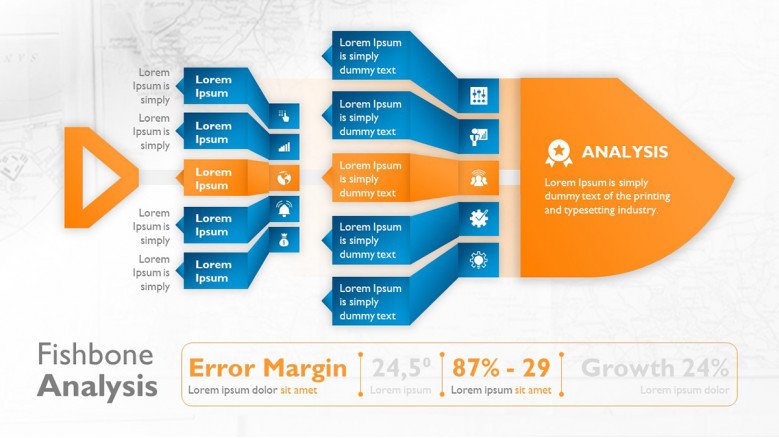
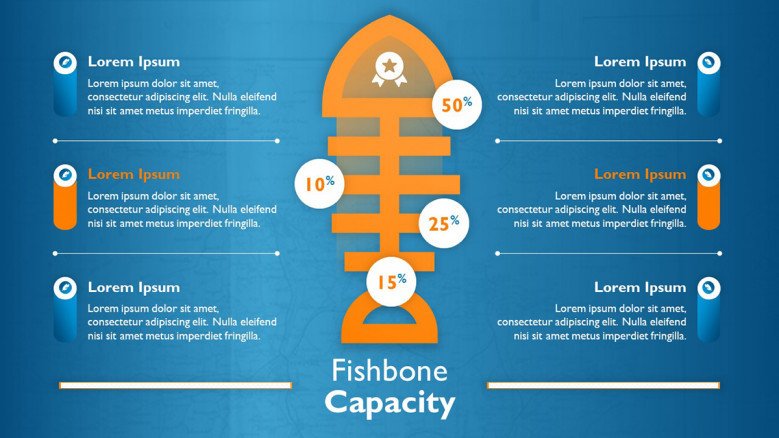
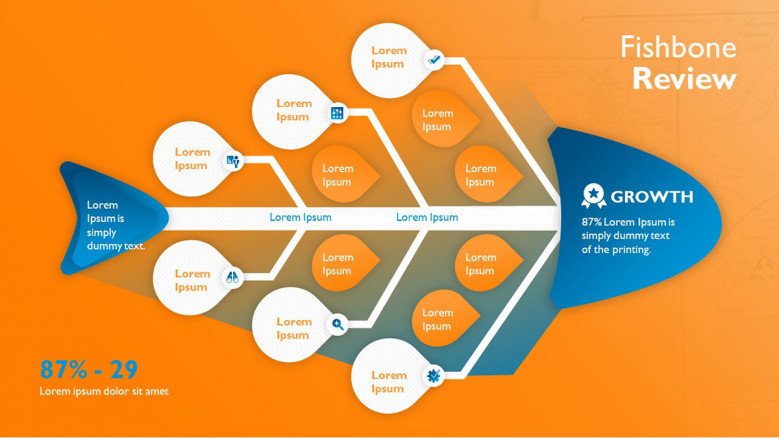
Fishbone diagrams are powerful tools for problem-solving and super easy to implement. The Simple Fishbone diagram included here is ideal to visualize a cause-and-effect analysis at a single glance. It comes with four sections and ten tags to organize potential causes in a clear and simple structure.
How to make the most out of your fishbone diagram? Categorizing the causes. You can use the sections in the fishbone spine to group potential causes. For example, if you detected a problem in a process, you may want to group your ideas in steps or sub-processes. In this way, you make sure you analyze all the stages of the process. You can also use roles, strategic areas, and other criteria.
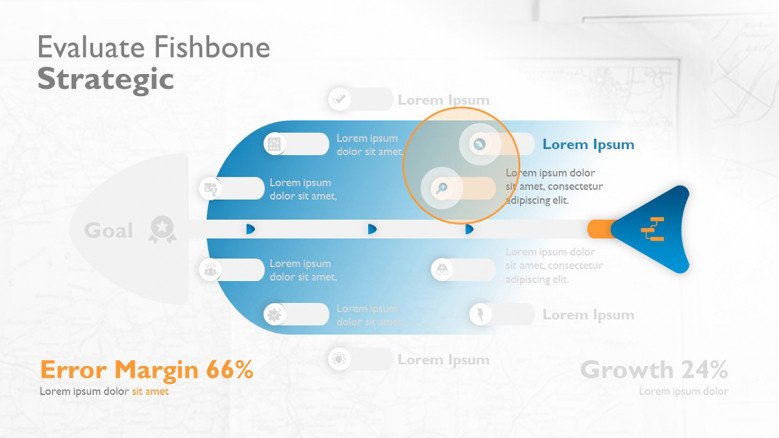
After conducting your root cause analysis, you need to resolve the issue. An innovative way to use the fishbone diagram is for planning. Once you’ve identified the core causes of the problem, propose a solution for each potential cause. At the end, you will turn the problem into a positive result.
All professional profiles benefit from Fishbone Mapping!
Fishbone Mapping involves a lot of "why’s" in the search for answers. This exercise makes people improve their critical-thinking skills and gain a deeper understanding of the issue.
Polish your value proposition
Whenever there is a problem, the fishbone diagram helps you detect the causes. Use it to analyze your customers’ pain points and get valuable information to improve your value proposition.
Brainstorming
Fishbone diagrams are perfect tools for brainstorming, one of the most-known problem-solving techniques. Everyone can add their ideas and visualize the points discussed in an organized diagram.






FIND OUT MORE ABOUT OUR CUSTOM DESIGN SERVICES
Check out other similar templates
Todd Speranzo
VP of Marketing at Avella
"24Slides helps us get PowerPoints on-brand, and improve overall design in a timeframe that is often “overnight”. Leveraging the time zone change and their deep understanding of PowerPoint, our Marketing team has a partner in 24Slides that allows us to focus purely on slide content, leaving all of the design work to 24Slides."
Gretchen Ponts
Strata Research
"The key to the success with working with 24Slides has been the designers’ ability to revamp basic information on a slide into a dynamic yet clean and clear visual presentation coupled with the speed in which they do so. We do not work in an environment where time is on our side and the visual presentation is everything. In those regards, 24Slides has been invaluable."
Nyah Pham
Novozymes
"After training and testing, 24Slides quickly learnt how to implement our CVI, deliver at a high quality and provide a dedicated design team that always tries to accommodate our wishes in terms of design and deadlines."