


Great slides, delivered to your inbox
Join thousands of professionals who get our best presentation tips, new templates, and design inspiration from the 24Slides team. Plus, if you ever need a fully custom deck — we’ll be a click away.

Reset your Password
Please enter the email you registered with and we will send you a link to reset your password!
Check your email!
We’ve just sent you a link to . Please follow instructions from our email.


A Balanced Scorecard measures a business’ organizational health from four perspectives: Financial, Customer, Internal Processes, and Organisational Capacity. This slide deck has been designed to offer you multiple tools of evolution. By using the charts and graphs from this presentation pack, you will be able to communicate clearly the status of the organization to all relevant stakeholders. Use the Performance Metrics Slide, the Action Flowchart Slide and the Category Tracking Slide to get objective measurements of an organization’s health.
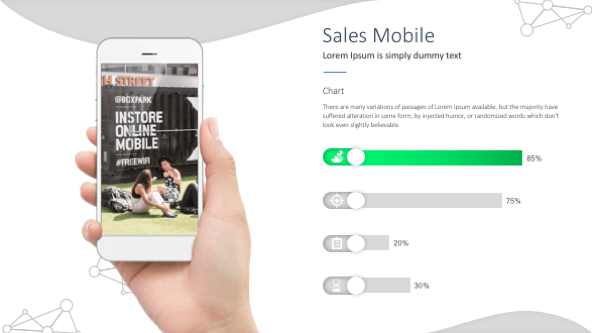
This slide presents multiple metrics against each other, all of them having a set of scores to be awarded at certain points in time. The Totals column makes an average of all the scores and allows stakeholders to easily understand how the company has performed against each metric.
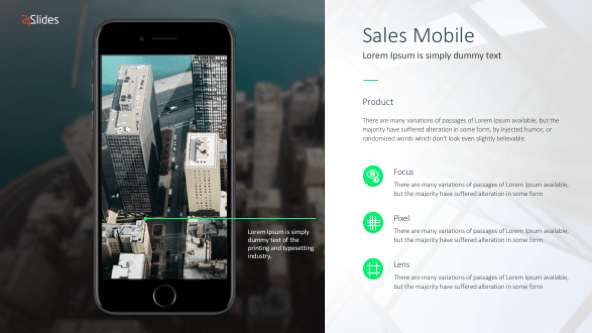
This flowchart can be designed by managers and team leads to explain how a process within a team works. Whether this is a team engagement process or a set of instructions for handling major incidents, this flowchart can be easily understood by anyone involved in the process at hand.
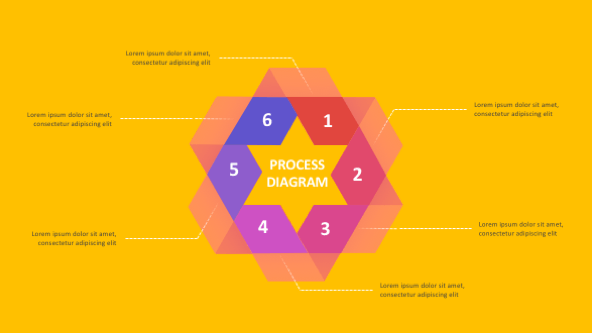
This chart allows you to sample multiple categories at different points in time. By having more than one data sets in a single graph, those who are required to interpret the data points will be able to see relationships between them and get additional insights into the performance according to those metrics.
Understand your current situation
Use the available tools to conduct regular assessments
Improve your organisational health
Get an understanding of how you’re operating and identify ways of improvement
Sow now to reap later
Doing efforts now to improve inefficiencies will make a huge difference in the future


FIND OUT MORE ABOUT OUR CUSTOM DESIGN SERVICES
Check out other similar templates

 69 fully
editable
slides
69 fully
editable
slides
Todd Speranzo
VP of Marketing at Avella
"24Slides helps us get PowerPoints on-brand, and improve overall design in a timeframe that is often “overnight”. Leveraging the time zone change and their deep understanding of PowerPoint, our Marketing team has a partner in 24Slides that allows us to focus purely on slide content, leaving all of the design work to 24Slides."
Gretchen Ponts
Strata Research
"The key to the success with working with 24Slides has been the designers’ ability to revamp basic information on a slide into a dynamic yet clean and clear visual presentation coupled with the speed in which they do so. We do not work in an environment where time is on our side and the visual presentation is everything. In those regards, 24Slides has been invaluable."
Nyah Pham
Novozymes
"After training and testing, 24Slides quickly learnt how to implement our CVI, deliver at a high quality and provide a dedicated design team that always tries to accommodate our wishes in terms of design and deadlines."