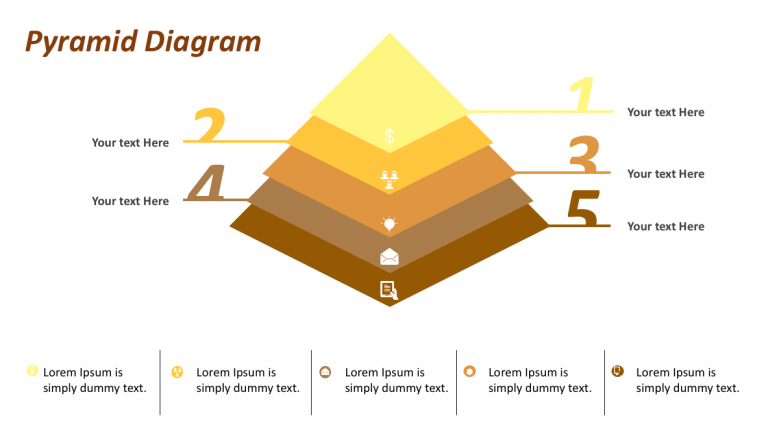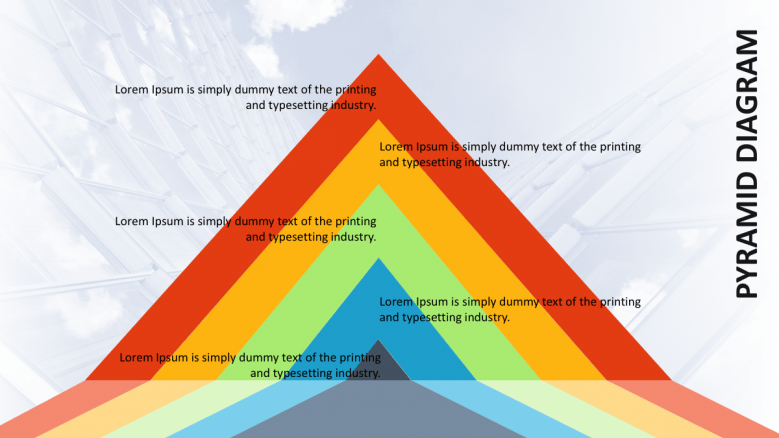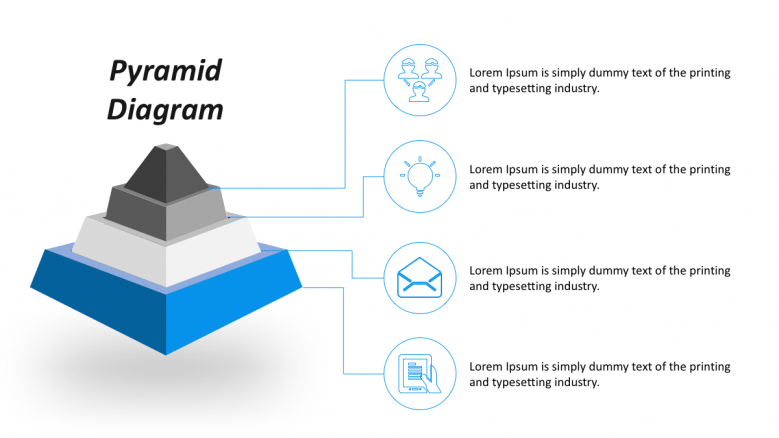
The pyramid chart has a triangular shape and there are lines inside it that divide it into different sections. Each of the sections is reserved for a particular topic or idea that has to be discussed. Each section is of different width and as such, they tend to represent a level of hierarchy between the items. Usually, the section in the bottom is meant to present a general issue, while the one on the top a specific one.
Usually pyramid charts with horizontal lines are used to represent organizational structures within the company. Because it’s designed to represent hierarchy, the executives are places on the top of the pyramid, while the middle section is reserved for the management and the bottom for the lower- ranking employees. The size of the chart will depend on the size of the company and organizational structure is usually changed according to the customers that it serves.
These types of charts are great for depicting the various organizational structures such as functional ones, product and matrix. For example, in functional organizational structures, the company is organized by finance, accounting, marketing and similar functions and managers hold titles accordingly. Also, department stores may use product structures where departments are organized by product type.
The 3D pyramid chart is very visual and has the same purpose as the abovementioned ones. It’s created as such in order to attract the attention of the audience and engage them in the presentation. The purpose of these charts is to enable for a better coordination of functions and for increased quality of the final outcome.
Pyramid charts have triangular shape with lines that divide them in different sections
Each of the sections should be related to a different topic and each of the section has a different width.
This template will enable you to more successfully represent hierarchical structures
You can use it to present the executives at the top and the lower-ranking employees at the bottom.
You will be able to efficiently describe various organizational structures such as functional, product and matrix
The visual pyramid chart will enable you to better coordinate the functions in the organization and to increase the quality of the final outcome.


FIND OUT MORE ABOUT OUR CUSTOM DESIGN SERVICES
Check out other similar templates
Todd Speranzo
VP of Marketing at Avella
"24Slides helps us get PowerPoints on-brand, and improve overall design in a timeframe that is often “overnight”. Leveraging the time zone change and their deep understanding of PowerPoint, our Marketing team has a partner in 24Slides that allows us to focus purely on slide content, leaving all of the design work to 24Slides."
Gretchen Ponts
Strata Research
"The key to the success with working with 24Slides has been the designers’ ability to revamp basic information on a slide into a dynamic yet clean and clear visual presentation coupled with the speed in which they do so. We do not work in an environment where time is on our side and the visual presentation is everything. In those regards, 24Slides has been invaluable."
Nyah Pham
Novozymes
"After training and testing, 24Slides quickly learnt how to implement our CVI, deliver at a high quality and provide a dedicated design team that always tries to accommodate our wishes in terms of design and deadlines."