


Great slides, delivered to your inbox
Join thousands of professionals who get our best presentation tips, new templates, and design inspiration from the 24Slides team. Plus, if you ever need a fully custom deck — we’ll be a click away.

Reset your Password
Please enter the email you registered with and we will send you a link to reset your password!
Check your email!
We’ve just sent you a link to . Please follow instructions from our email.


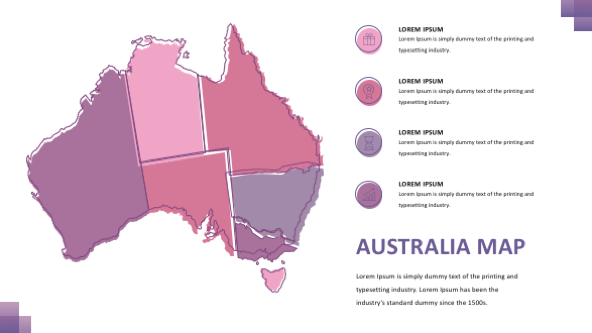
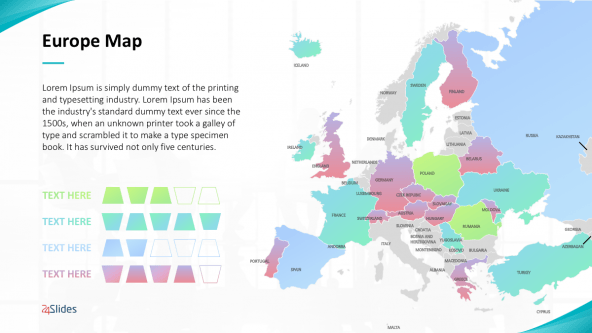
The map template is suitable for presenting the company’s performance in different regions. This one is tailored to satisfy the needs of the companies that operate in South America. By using it, you can easily show sales numbers, total revenue, profit or cash flows. It is great for comparing different regions and showing different relationships. The overall design of the template is highly creative and very appealing to every audience.
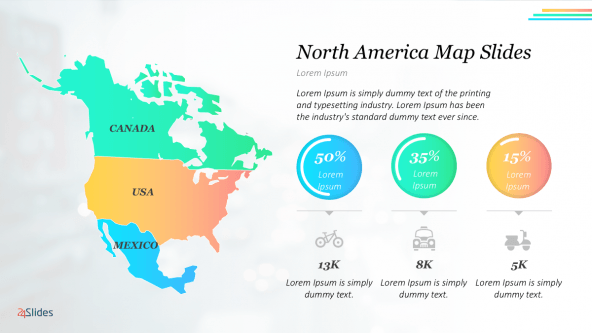
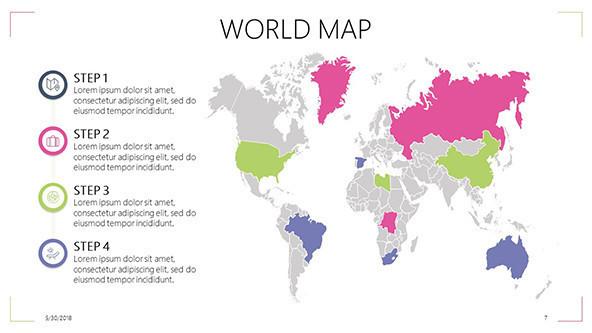
You can use this slide to show in which countries from South America your company performs the best. Also, it is suitable for defining your most frequent customers in terms of gender, age and preferences. It is wise to use the clustered column chart for a direct comparison of multiple data series and in order to not become complex, it’s the best to use it for a smaller amount of data.
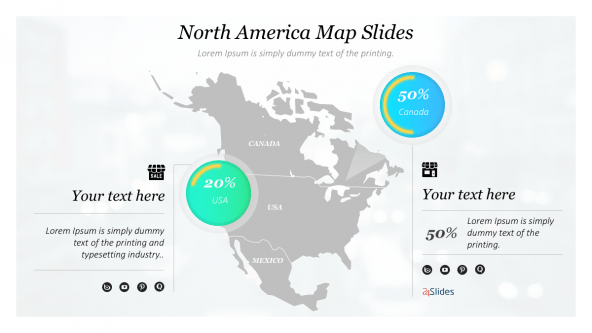
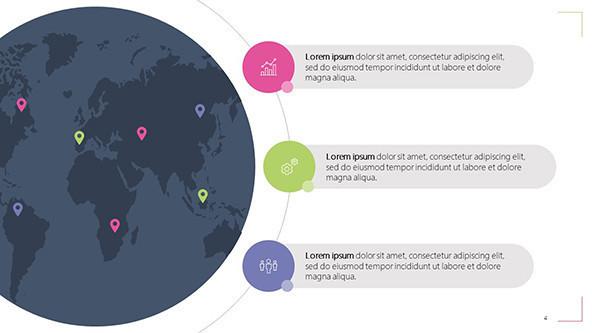
This is another creative slide with the map of South America. You also present valuable company’s data with suitable pie charts. You can show how much out of the total revenues or sales a certain region has earned. You can use the charts to compare the results and develop plans for improvement. Also, you can use it to deal with certain challenges related to these regions.
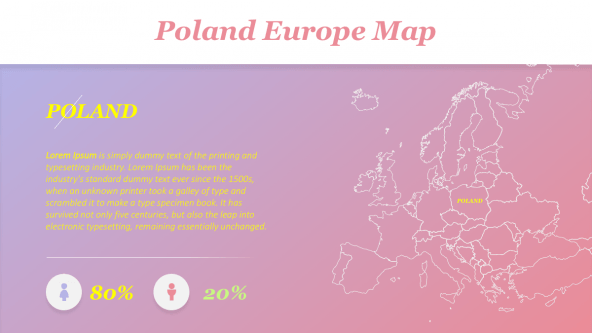
If you want to share a historical fact, this is the right place. You can briefly analyze a particular industry or the country’s economy in the past. You can compare it with the present factors and as a consequence, make valuable decisions regarding the company’s future.
The South America Map template is useful for presenting the company’s different performance in different countries
You can easily show important indicators by creating a comprehensible and engaging presentation.
The Clustered Column Chart is great for comparing multiple data series
It is useful for comparing numbers of different regions as long as the amount of data is limited and simple.
Using the pie chart you can present valuable data regarding the company’s operations
You can successfully present the total revenue or total sales of a certain region.


FIND OUT MORE ABOUT OUR CUSTOM DESIGN SERVICES
Check out other similar templates

 69 fully
editable
slides
69 fully
editable
slides

Todd Speranzo
VP of Marketing at Avella
"24Slides helps us get PowerPoints on-brand, and improve overall design in a timeframe that is often “overnight”. Leveraging the time zone change and their deep understanding of PowerPoint, our Marketing team has a partner in 24Slides that allows us to focus purely on slide content, leaving all of the design work to 24Slides."
Gretchen Ponts
Strata Research
"The key to the success with working with 24Slides has been the designers’ ability to revamp basic information on a slide into a dynamic yet clean and clear visual presentation coupled with the speed in which they do so. We do not work in an environment where time is on our side and the visual presentation is everything. In those regards, 24Slides has been invaluable."
Nyah Pham
Novozymes
"After training and testing, 24Slides quickly learnt how to implement our CVI, deliver at a high quality and provide a dedicated design team that always tries to accommodate our wishes in terms of design and deadlines."