This template is created for delivering a successful comparison of performance between different departments and organizations. It is suitable for tacking the improvement in different fields, such as marketing, sales, supply chain and etc. That way you will be able to see which activities perform well and which ones need to be further improved and implemented. The design is very professional and allows for creative illustration of the critical values.
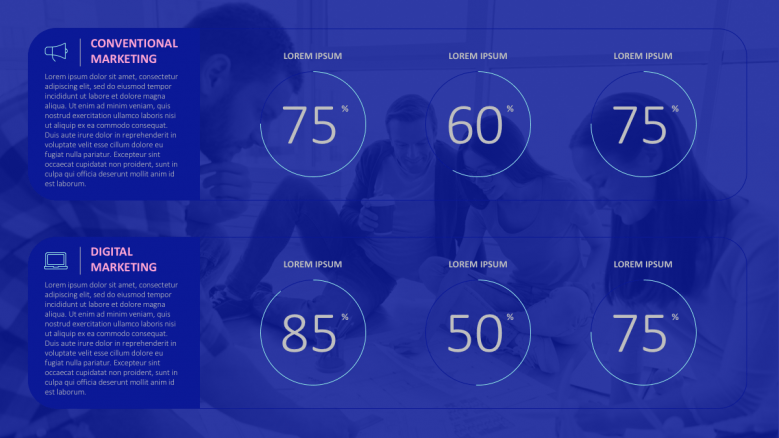
If you have recently transitioned from conventional to digital marketing, then this is the right place to show the impact that it had on the company’s performance. You can list different metrics related to the marketing performance such as activity metrics, output metrics, and operational metrics. They encompass revenue, profit, different costs, win rate, pipeline contribution, etc.
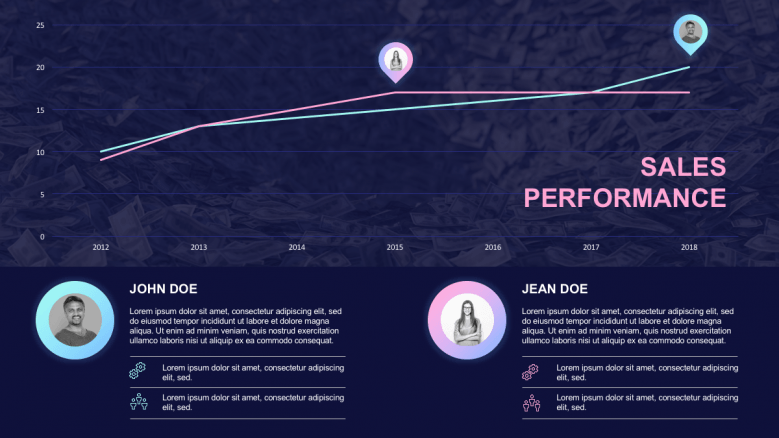
There are different possibilities for demonstrating sales performances and one way to do it by the line chart. It is supposed to connect different data points with a straight line. For example, each of the lines can be related to a particular salesperson and show their amount of sales throughout time. It is a good way to track the employees’ performance and further improve their activities.
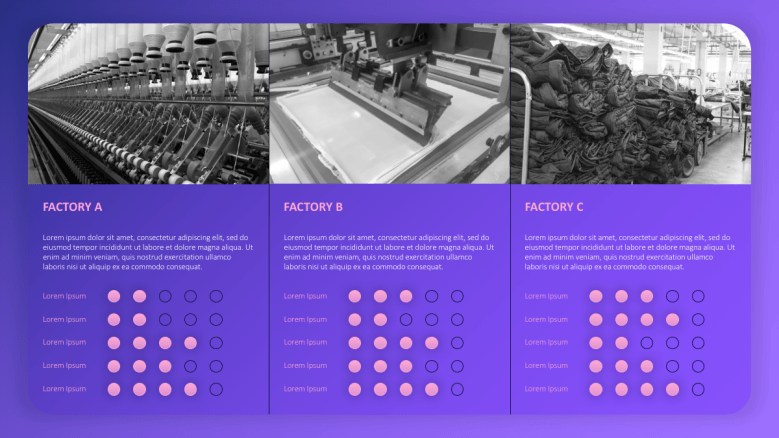
Not every comparison should be in terms of time. Many big corporations have several production sites and it is important for them to track their performance. Because one factory may be more productive than another one, it is important to have a clear representation of their operations. By doing this, you will be able to implement better measures to improve their work and mitigate any potential adversities.
Successful comparison of the performance of different departments and organizations
You can easily track and compare operations in different fields and further improve them.
Before and after effects of the implementation of digital marketing
You can compare how much has the company improved after changing the marketing strategy.
Better tracking of the operational activities of several production sites
By having a clear picture of their operations, you can mitigate any potential risks.


FIND OUT MORE ABOUT OUR CUSTOM DESIGN SERVICES
Check out other similar templates
Todd Speranzo
VP of Marketing at Avella
"24Slides helps us get PowerPoints on-brand, and improve overall design in a timeframe that is often “overnight”. Leveraging the time zone change and their deep understanding of PowerPoint, our Marketing team has a partner in 24Slides that allows us to focus purely on slide content, leaving all of the design work to 24Slides."
Gretchen Ponts
Strata Research
"The key to the success with working with 24Slides has been the designers’ ability to revamp basic information on a slide into a dynamic yet clean and clear visual presentation coupled with the speed in which they do so. We do not work in an environment where time is on our side and the visual presentation is everything. In those regards, 24Slides has been invaluable."
Nyah Pham
Novozymes
"After training and testing, 24Slides quickly learnt how to implement our CVI, deliver at a high quality and provide a dedicated design team that always tries to accommodate our wishes in terms of design and deadlines."