This template is designed to help you visualize numerical data for your company. Numbers can be really confusing and therefore, it is of utmost importance that they are presented in a comprehensible manner. The waterfall diagram is an easy way to quickly plug in the numbers and obtain a well- organized and professional presentation that will be appealing to any kind of audience.
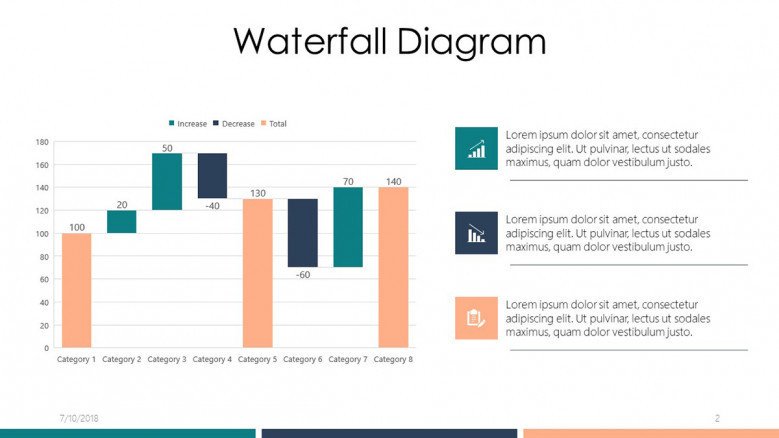
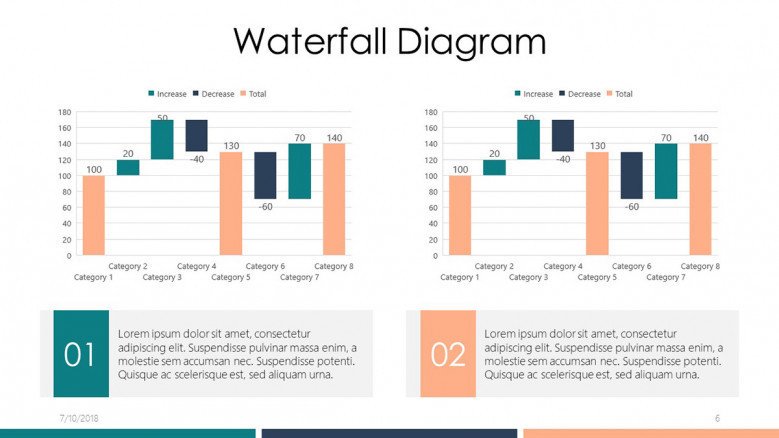
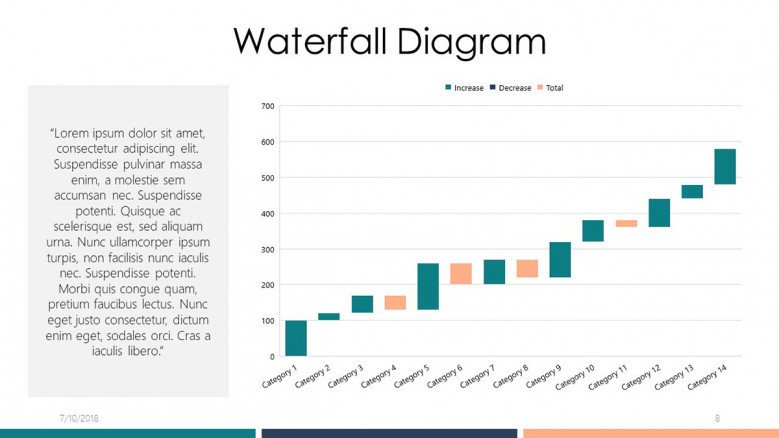
You can start the presentation by using the traditional waterfall diagram. This chart will enable you to better understand the cumulative effect of positive and negative values that impact the initial value. You can easily edit it in order to keep it up-to-date with the latest company’s data.
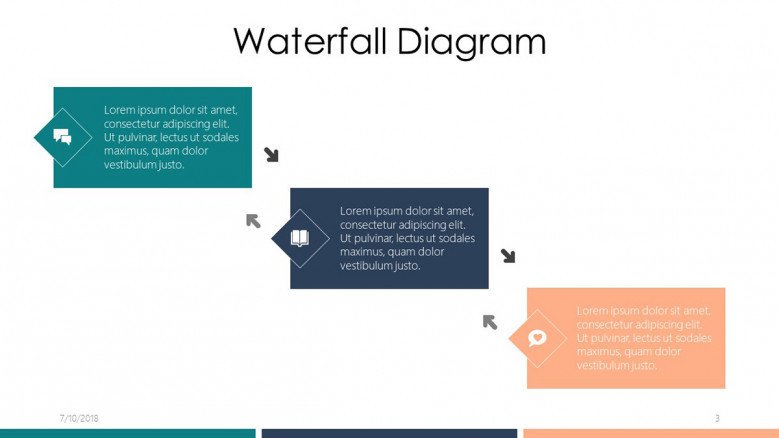
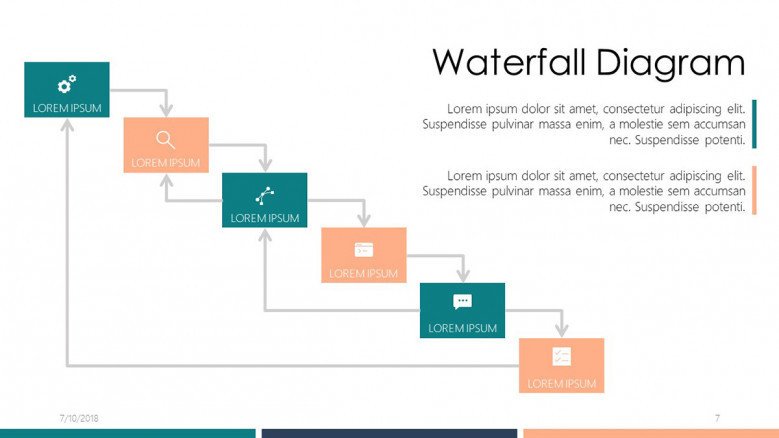
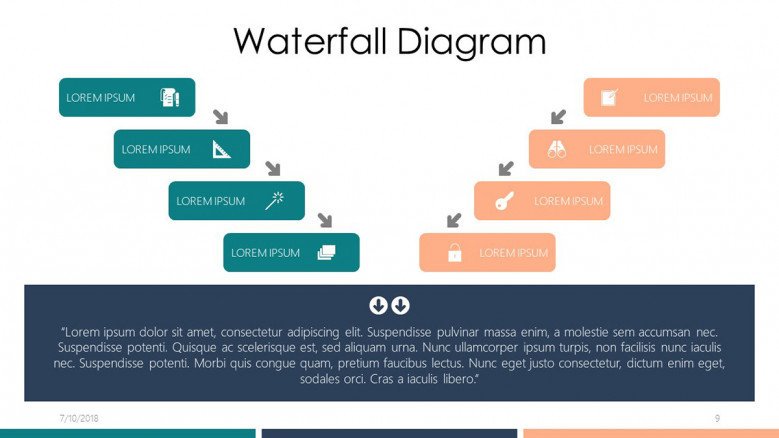
Another great application of the Waterfall effect is through this waterfall process. It is used to show a descending process with multiple steps and sub-steps and arrows that are directed both ways. It can also show a sequence of tasks and events that can occur several times. Works best with small amounts of text.
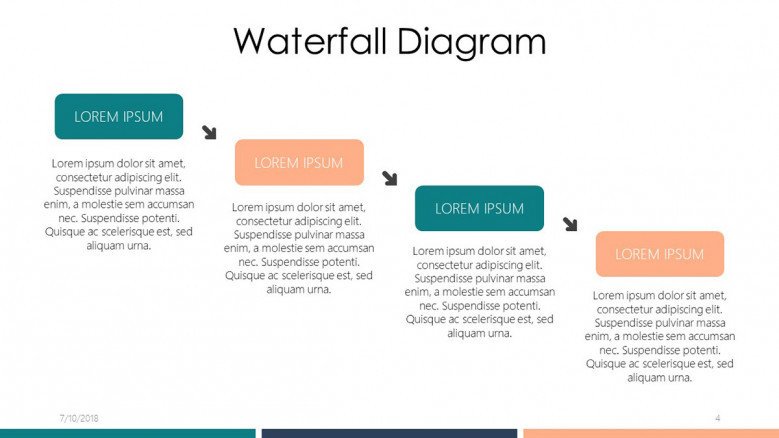
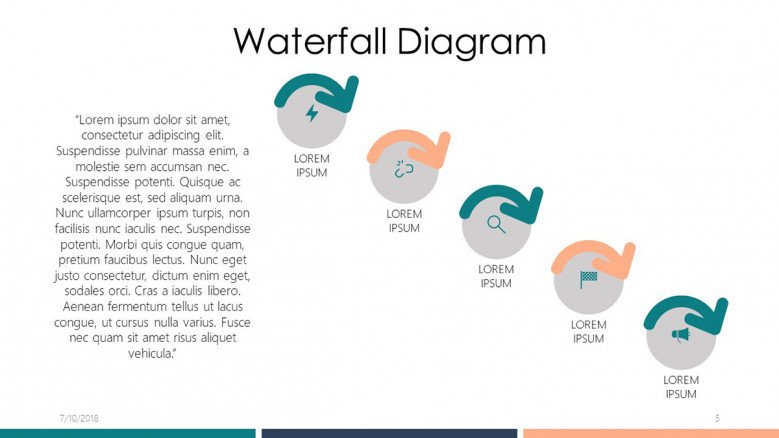
Similarly as the waterfall process, this circle arrow waterfall it’s used to show sequential items with supporting text for each item. Instead of small boxes, this process has circles with arrows that can show the direction in which the task is being completed. You can add as many circles as you want so that it can fit your company’s processes.
The waterfall diagram is great for visualizing numerical data
You can easily plug in the numbers and obtain a chart that will be comprehensible for everybody.
The traditional waterfall chart allows you to better understand cumulative effects of positive and negative values
The initial value changes in accordance with the above mentioned values.
The waterfall process is of descending nature
It can show a sequence of tasks and events that may occur several times.



FIND OUT MORE ABOUT OUR CUSTOM DESIGN SERVICES
Check out other similar templates
Todd Speranzo
VP of Marketing at Avella
"24Slides helps us get PowerPoints on-brand, and improve overall design in a timeframe that is often “overnight”. Leveraging the time zone change and their deep understanding of PowerPoint, our Marketing team has a partner in 24Slides that allows us to focus purely on slide content, leaving all of the design work to 24Slides."
Gretchen Ponts
Strata Research
"The key to the success with working with 24Slides has been the designers’ ability to revamp basic information on a slide into a dynamic yet clean and clear visual presentation coupled with the speed in which they do so. We do not work in an environment where time is on our side and the visual presentation is everything. In those regards, 24Slides has been invaluable."
Nyah Pham
Novozymes
"After training and testing, 24Slides quickly learnt how to implement our CVI, deliver at a high quality and provide a dedicated design team that always tries to accommodate our wishes in terms of design and deadlines."