How To Make An Infographic In PowerPoint
The first thing people think about when they hear the word infographic is probably Photoshop, not PowerPoint. You can do a lot of graphics pretty quickly in Photoshop if you’re quite handy with that software, or any other graphics software, for that matter. PowerPoint is not a well-known graphics creator, but you can make one just fine! If you’re curious how to go about doing this, then you’re in luck because, in today’s article, I’m going to show you how to make an infographic in PowerPoint.

Why Use Infographics?
Infographics are all the rage nowadays. Everywhere you look, you see infographics of basically any topic you can think of. And it’s really not surprising why. Humans are visual creatures, and as such we prefer a visual illustration as opposed to reading 10 pages of the same stuff. The old saying, “A picture paints a thousand words,” holds true even to this day. Even on social media, you’ll notice people sharing memes, infographics, and other forms of graphics, because these are far easier to consume and understand.
Infographics allow you to present information in a succinct and efficient manner. If you’ve got information, you can turn it into an infographic. You just need to have a plan in place on how you’re going to lay out your information into something that can be easily consumed by your audience.
For bloggers, digital marketers and other website owners who care about optimizing their website rankings on search engines (SEO), infographics can be a useful tool to gain additional backlinks and traffic to their sites. Often, an infographic presentation gets more shares on social media rather than lengthy blog posts themselves.
Not too many content creators use infographics to complement their written content because creating infographics in PowerPoint, or any other software, take time and, in most cases, money. But if you know how to use PowerPoint, and you’ve got some spare time, then you can create infographics yourself.
How To Make An Infographic In PowerPoint
There’s no standard design or even sizes for infographics. Plain and simple, you’re only limited by your creativity and imagination. But, for starters, the first thing normally have to do when making an infographic in PowerPoint is to resize the slides to a size commonly used for infographics. Different platforms have different recommended sizes, so you have to consider as well where you’re going to be posting or sharing your PowerPoint infographic.
How To Resize Your Slides For Your Infographic
- Go to Design > Slide Size > Custom Slide Size.

(Caption: How to resize your PowerPoint slide for your infographic)
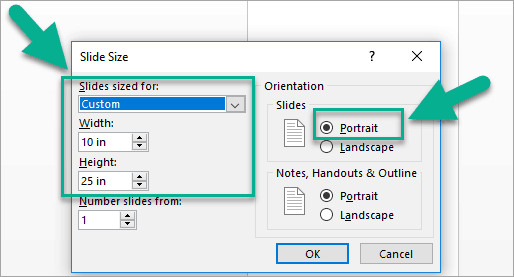
2. In the Slide Size dialog box that pops-up, select Custom in the drop-down for Slides sized for. Then type in the width and height (in inches) and select the orientation (portrait or landscape). Normally for infographics, the orientation used is portrait.
You’re free to set your own size, but as you can see in the screenshot, I set the width to 10 inches and the height to 25 inches.
(Caption: Use a custom slide size for your PowerPoint infographic)
3. This is my new slide size for my infographic:
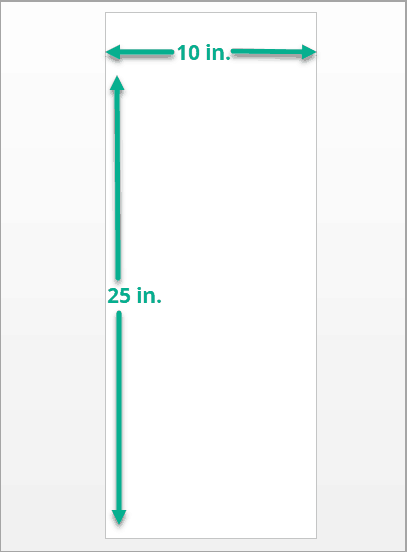
(Caption: The new slide size for our PowerPoint infographic example)
How To Format The Background For Your Infographic
Your infographic can retain its original white background. But if you’d like to add some color and style, you should consider changing the background to something that will catch the eye of your intended audience.
To change the background, right click on a blank spot on your infographic slide and select Format Background. The Format Background pane will then appear on your screen.
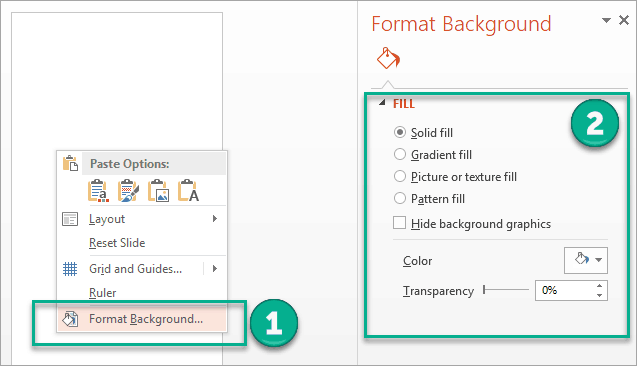
(Caption: How to format the background for your PowerPoint infographic)
You can decide whether you want to use a solid fill, a gradient fill, a picture or texture fill, or a pattern fill. Choose the most appropriate background that’s going to fit in with the infographic as well as the message you’re trying to convey to your audience.
How To Use SmartArt For Your PowerPoint Infographic
You can easily use custom shapes and vector graphics, but for beginners, SmartArt is one of the easiest ways to get started with an infographic on PowerPoint as it provides responsive graphics (there’s a reason it’s called SmartArt).
Go to Insert > SmartArt and choose a graphic that will look good for your infographic. Hit OK when you’re done choosing.
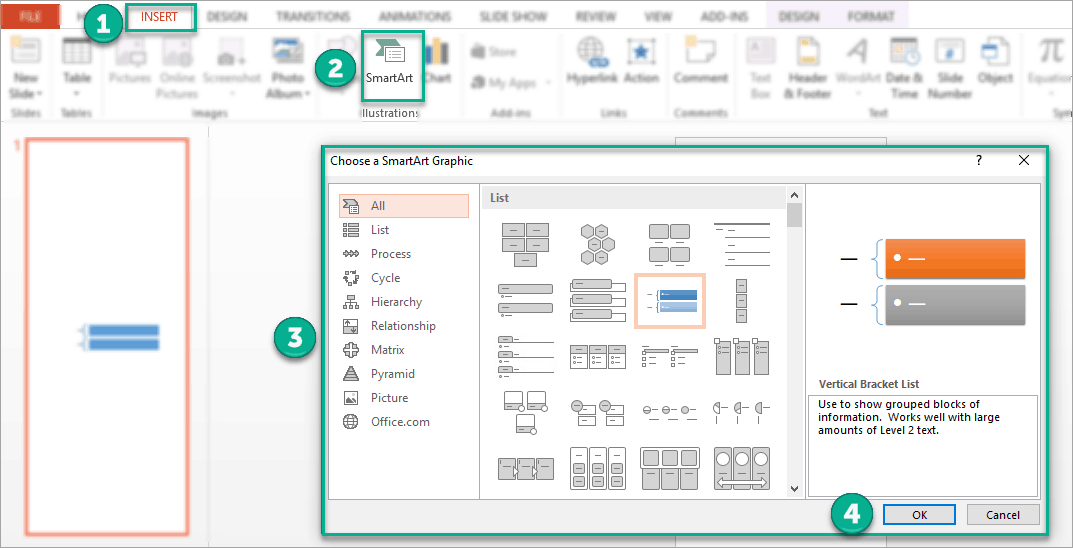
(Caption: How to use SmartArt graphics for your PowerPoint infographic)
To format and design your SmartArt, simply click on the graphic first so that the SmartArt Tools pane will appear. Choose from either the Design or Format tab.
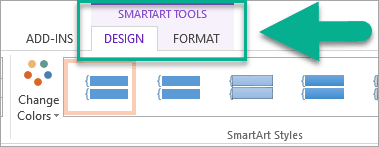
(Caption: Use SmartArt Tools to format and design your PowerPoint infographic)
Play around with the different options until you get your infographic design just right.
At this point, you can decide how you want to design your infographic. You can use a combination of SmartArt graphics and other elements like vector graphics, some nice fonts that complement your message, etc.
More Tips On How To Create And Design Infographics In PowerPoint
There’s more to creating infographics than just resizing the slide, creating nice backgrounds, and using SmartArt or custom graphics. If you’ll remember the reason why you’re creating an infographic, then you’ll realize that you need to actually put a lot of thought into creating one. Depending on your industry, you may have lots of competition so you’d have to think of a way to create an infographic that will catch your audience’s attention. Here are a few more tips:
- Get inspiration from other outstanding infographics.
You can get plenty of ideas by browsing sites like Pinterest, Visual.ly, or even Google Images. See what your competitors are doing and check if you can do a much better infographic.
- Keep it focused.
Don’t talk about everything in your infographic. Rather, you should only focus on one topic. If your topic has a lot of sub-topics, then you can try using only the main points so as not to put too much information on your infographic.
- Keep it simple.
If you keep your infographic focused, then it’s easier to keep it simple as well. You don’t need to worry about overloading your audience with too much information. Likewise, use simple colors and a simple layout. Don’t try to overcomplicate things.
- Think of an attention-grabbing headline.
Your headline should accurately describe what your infographic is all about. You don’t have to make it clickbait-y, but if it gets you more views, then I don’t see any problem with it.
- Make sure your story flows.
You don’t want your audience to get lost in your infographic. Having a storyline or a timeline in place is great, so your audience knows the sequence of your story.
Final Words
Creating an infographic in PowerPoint is not easy, but it’s certainly doable. It will take time and an eye for good design (or at least some good research skills). Now that you’ve got an idea on how to make an infographic in PowerPoint, it’s time to plan how you’re going to be making yours from scratch.

At 24slides, we create world-class presentation designs, animations, and infographics. Take a look at some of our examples and get an instant quote for your professional infographic.