


Great slides, delivered to your inbox
Join thousands of professionals who get our best presentation tips, new templates, and design inspiration from the 24Slides team. Plus, if you ever need a fully custom deck — we’ll be a click away.

Reset your Password
Please enter the email you registered with and we will send you a link to reset your password!
Check your email!
We’ve just sent you a link to . Please follow instructions from our email.


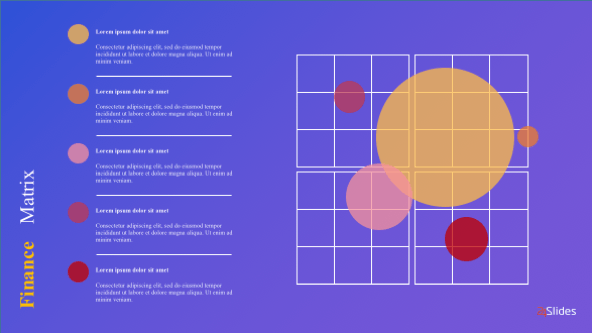
Communicating with your stakeholders or higher management is very time-sensitive. Information must be quick, clear and concise. This slide deck will help you deliver exactly that. Using stylish graphs, you can present your results and reports quickly. Cover the most important aspects of a high-level presentation such as the market distribution and global reach, and display your results using bar charts, waterfall charts, and 2D graphs.
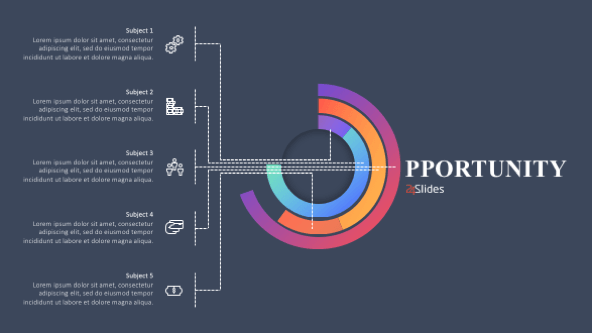
This compact 2-in-1 slide can cover a lot of information in a small space. Display which platforms are most used by your customers to interact with your company. Use a geopolitical map to display where your company performs the best. Go further into the analysis by taking a closer look at your client base and their information.
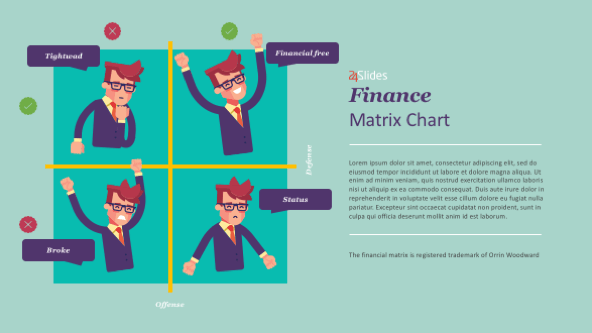
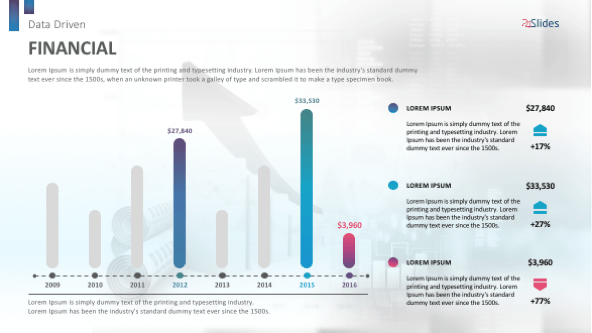
Bar charts are great for comparing two different results and create an immediate impact. However, they might lack a sense of depth when it comes to presenting information. Adding a few quick comments next to the chart can help solve this problem and engage the audience.
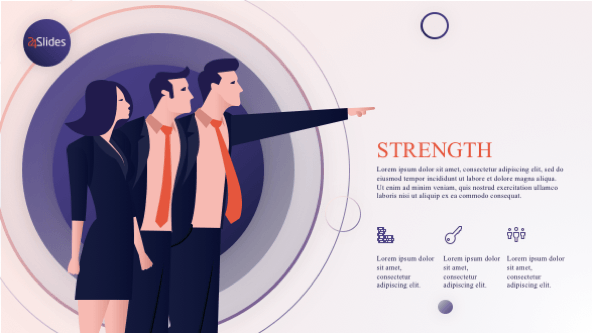
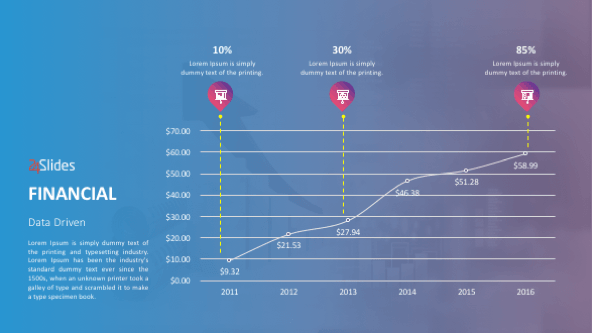
This slide allows you to present multiple data points in an intuitive way. You can plot on the 2D chart to display the strengths and weaknesses in your performance and compare it with competitors. The waterfall chart can be used to present the results across time with a clear indicator of profitable and unprofitable time periods.
Communicate more information in less time
Give all the details to the right people in order to help them make good judgements and decisions quickly and accurately
Capture attention with stunning graphics
When time is short, you need to get your audience focused on what you are presenting
Keep text to a minimum
A picture is worth 1000 words. A graph is worth even more. Text takes more time to read and it’s harder to retain information compared to graphs and images


FIND OUT MORE ABOUT OUR CUSTOM DESIGN SERVICES
Check out other similar templates

 69 fully
editable
slides
69 fully
editable
slides
Todd Speranzo
VP of Marketing at Avella
"24Slides helps us get PowerPoints on-brand, and improve overall design in a timeframe that is often “overnight”. Leveraging the time zone change and their deep understanding of PowerPoint, our Marketing team has a partner in 24Slides that allows us to focus purely on slide content, leaving all of the design work to 24Slides."
Gretchen Ponts
Strata Research
"The key to the success with working with 24Slides has been the designers’ ability to revamp basic information on a slide into a dynamic yet clean and clear visual presentation coupled with the speed in which they do so. We do not work in an environment where time is on our side and the visual presentation is everything. In those regards, 24Slides has been invaluable."
Nyah Pham
Novozymes
"After training and testing, 24Slides quickly learnt how to implement our CVI, deliver at a high quality and provide a dedicated design team that always tries to accommodate our wishes in terms of design and deadlines."