


Great slides, delivered to your inbox
Join thousands of professionals who get our best presentation tips, new templates, and design inspiration from the 24Slides team. Plus, if you ever need a fully custom deck — we’ll be a click away.

Reset your Password
Please enter the email you registered with and we will send you a link to reset your password!
Check your email!
We’ve just sent you a link to . Please follow instructions from our email.


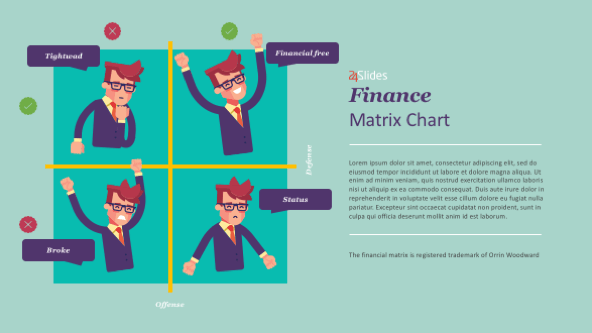
The core of each business’s success is the data analysis. Each high-quality presentation should be based on reliable research and analytics tools. Data analysis will help you to illustrate trends more easily and to show important relationships among variables. This template will enable you to successfully present the financial data in front of shareholders and executives. Your presentation will be well structured and professional. All of the datasets can be easily edited in Excel or Sheets, while the template’s colors and shapes can be tailored to one’s current preferences.
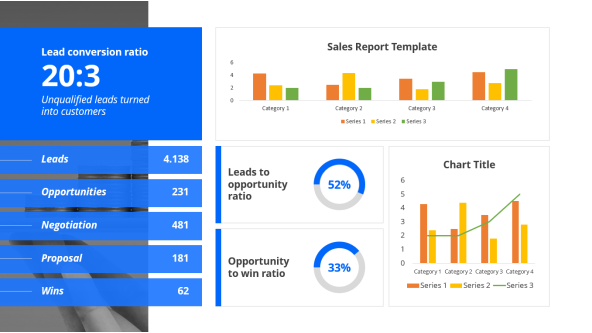
The common data-driven presentations are meant for comparing relative performances based on discrete parameters. Usually, those parameters are the product of different feedback surveys, questionnaires, feasibility studies, relevant projects, or business strategies. Through the usage of the column charts, you can demonstrate your company’s financial performance at a different point in time. You can compare it to past performances and use its current one to predict future outcomes.
Another way to show financial performance is through the line chart. This chart demonstrates information as a series of data points which are connected though a straight line. They are ideal for comparing changes over a particular time period for several data groups. If you are operating in the financial sector, one of the ways you can use them is for monitoring closing prices on stock exchanges.
If you want to create a clear picture of your company’s sales, expenses, and profit, then you can do so by using bar charts. Also, you can show the overall cash flow and demonstrate how liquid the company is. This is of utmost importance for shareholders and investors because it shows how well the company can deal with adversity.
Sophisticated template for Financial Data presentation in front of shareholders and investors
Professional outlook of the whole presentation that will engage the audience’s attention.
Easy-to- follow and well-organized presentation
Simple design that is comprehensible, but yet very thoroughly structured.
Different graph styles that will capture every aspect of your company’s financial performance
The template offers high visualisation of the business’s most important facts.


FIND OUT MORE ABOUT OUR CUSTOM DESIGN SERVICES
Check out other similar templates

 69 fully
editable
slides
69 fully
editable
slides


Todd Speranzo
VP of Marketing at Avella
"24Slides helps us get PowerPoints on-brand, and improve overall design in a timeframe that is often “overnight”. Leveraging the time zone change and their deep understanding of PowerPoint, our Marketing team has a partner in 24Slides that allows us to focus purely on slide content, leaving all of the design work to 24Slides."
Gretchen Ponts
Strata Research
"The key to the success with working with 24Slides has been the designers’ ability to revamp basic information on a slide into a dynamic yet clean and clear visual presentation coupled with the speed in which they do so. We do not work in an environment where time is on our side and the visual presentation is everything. In those regards, 24Slides has been invaluable."
Nyah Pham
Novozymes
"After training and testing, 24Slides quickly learnt how to implement our CVI, deliver at a high quality and provide a dedicated design team that always tries to accommodate our wishes in terms of design and deadlines."