
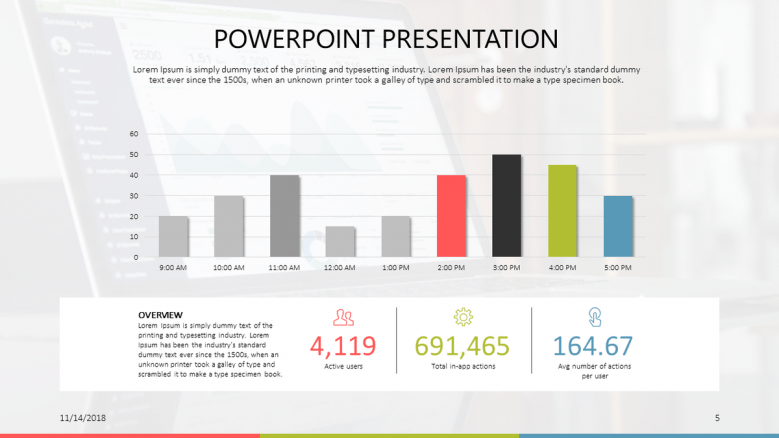
Data is everywhere. All actions, especially those made in a digital environment, leave a data footprint. However, it carries no significant meaning by itself. The process of analysis and interpretation is what makes data so powerful, as it gets converted into knowledge. To make intelligent business decisions, you need to analyse your data and gathering significant insights. Going one step further, to share this newfound knowledge with your team, you need to convert the data into an easily digestible format that can be quickly and accurately interpreted. This slide pack provides you with multiple ways in which you can convert data into meaningful graphics that can help your stakeholders understand the current business environment.
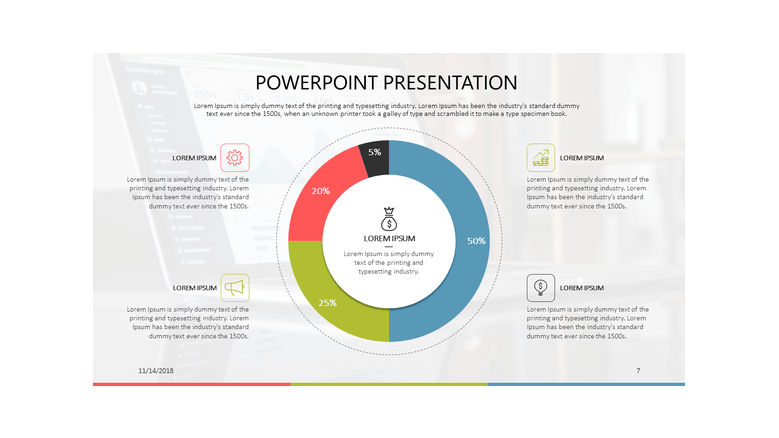
Arguably the most popular of them all, pie charts split a total number into its components. For example, after calculating the total profits made by your business, this pie chart can help you break down where each revenue stream came from, which was the most profitable, and how you can use this information to make future decisions in regards to capital allocation.
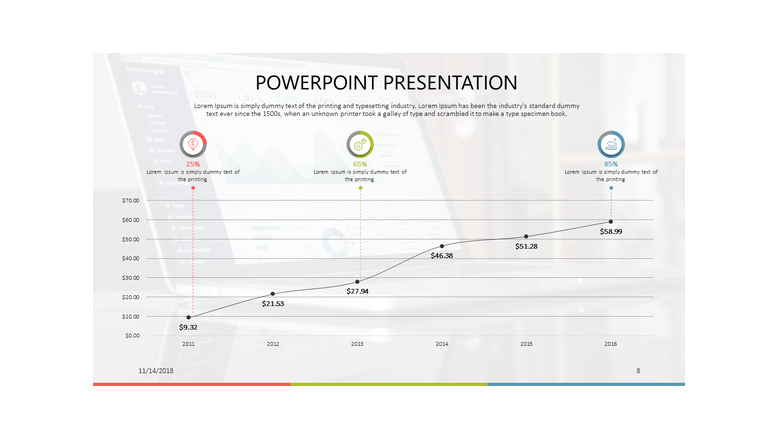
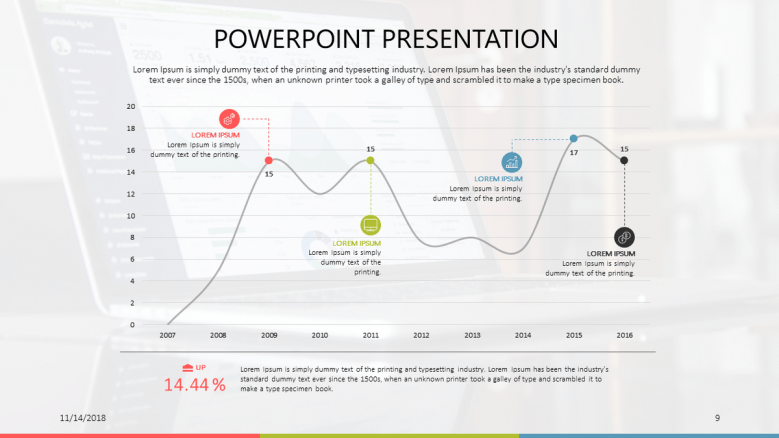
Tracking the progress of a metric across time is useful in understanding how it behaves and what influences it. Looking at the peaks and troughs can offer you valuable information in regards to events that had an impact on the metric. Adding annotations to those key points will help you present to your stakeholders how your choice affected the performance and what the next steps need to be.
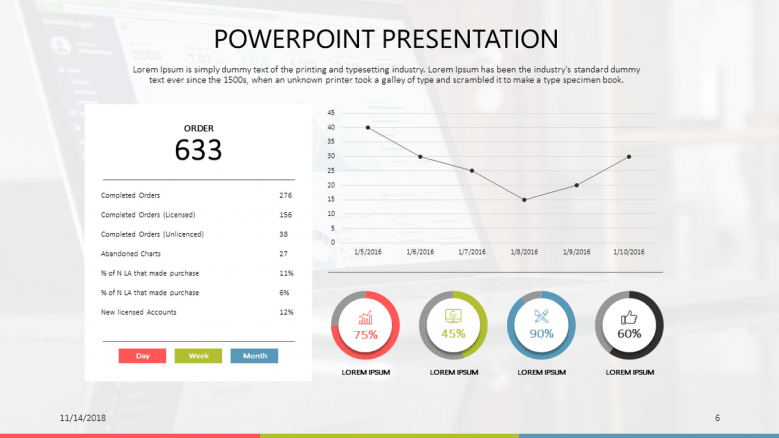
Having a set of well-defined goals is the best way of driving your actions in the right direction. At specific times, such as the beginnings of new financial years, you can look back and compare your performance against the goals set earlier. This dashboard offers you numerous choices for goal setting and performance tracking.
Data is overwhelming unless interpreted adequately
Make sure you look for the correct information and analyse it meaningfully
Communications is just as important as data
Compress data into simple and meaningful information for your teammates to understand and use
Collect Data at every point
Keep a track of all your actions. Data might be tipping the balance in your favour


FIND OUT MORE ABOUT OUR CUSTOM DESIGN SERVICES
Check out other similar templates
Todd Speranzo
VP of Marketing at Avella
"24Slides helps us get PowerPoints on-brand, and improve overall design in a timeframe that is often “overnight”. Leveraging the time zone change and their deep understanding of PowerPoint, our Marketing team has a partner in 24Slides that allows us to focus purely on slide content, leaving all of the design work to 24Slides."
Gretchen Ponts
Strata Research
"The key to the success with working with 24Slides has been the designers’ ability to revamp basic information on a slide into a dynamic yet clean and clear visual presentation coupled with the speed in which they do so. We do not work in an environment where time is on our side and the visual presentation is everything. In those regards, 24Slides has been invaluable."
Nyah Pham
Novozymes
"After training and testing, 24Slides quickly learnt how to implement our CVI, deliver at a high quality and provide a dedicated design team that always tries to accommodate our wishes in terms of design and deadlines."