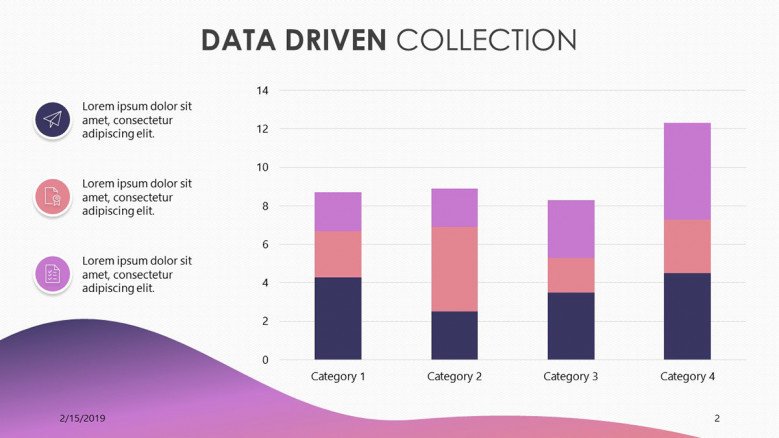
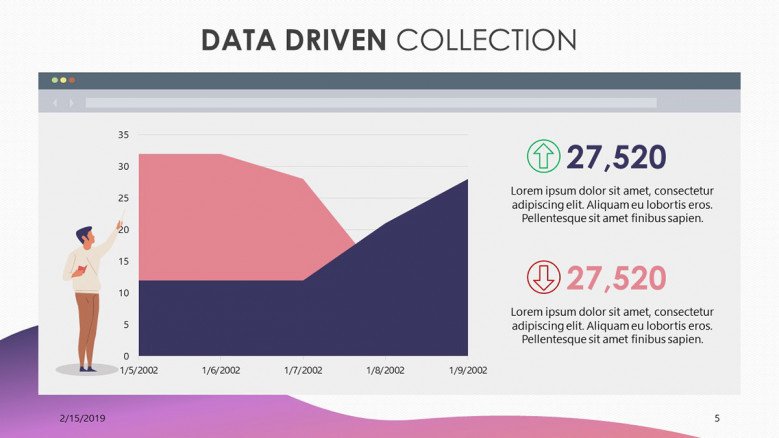
Nowadays, all online activity leaves a data footprint that is ready to be collected, analyzed and interpreted. It offers companies incredible amounts of information which they can use to create better products and target the appropriate customers much easier. One major part of the Data Analysis process is the communication of results in an engaging and clear manner. This slide deck will enable you to do exactly this, as you will have access to tools which can present complex data in an easy to understand manner. Use the Radar Chart slide, the Waterfall Statistics Slide, and the Treemap Slide to neatly package information ready for consumption.
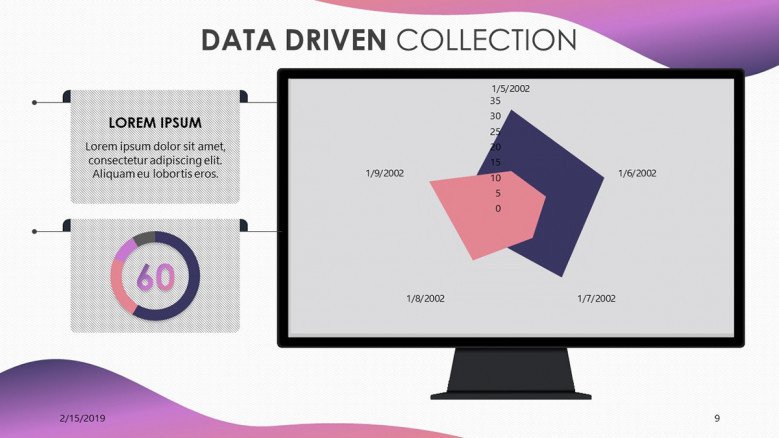
This type of chart is exceptional at presenting multiple data points in a visual way that enables the viewer to understand the relationship between metrics. It offers a snapshot of a set of KPIs at a specific point in time. In addition, using color coding, multiple sets of metrics can be presented simultaneously to showcase the difference in performance.
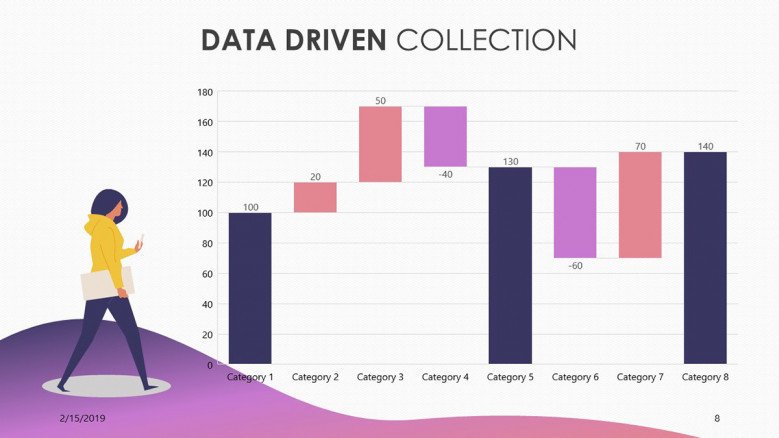
Waterfall charts are excellent at tracking the progress and getting an understanding of the impact of each reported point on the overall value. Mainly used in stock market analysis, waterfall charts don’t only display a value of a metric at a point in time, but they also present the difference between the previous and the current metric.
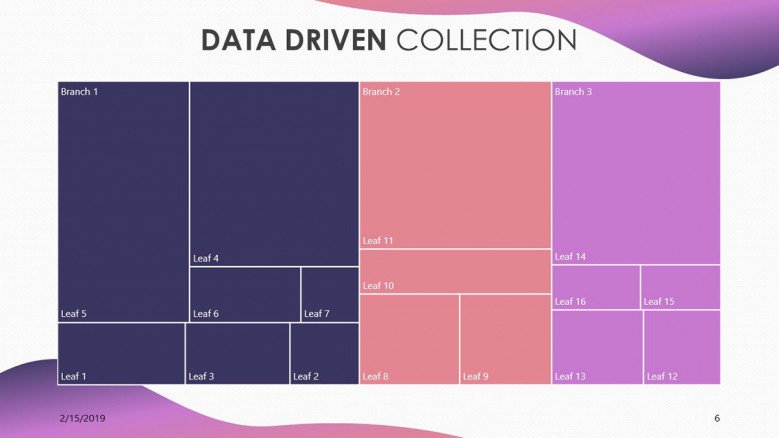
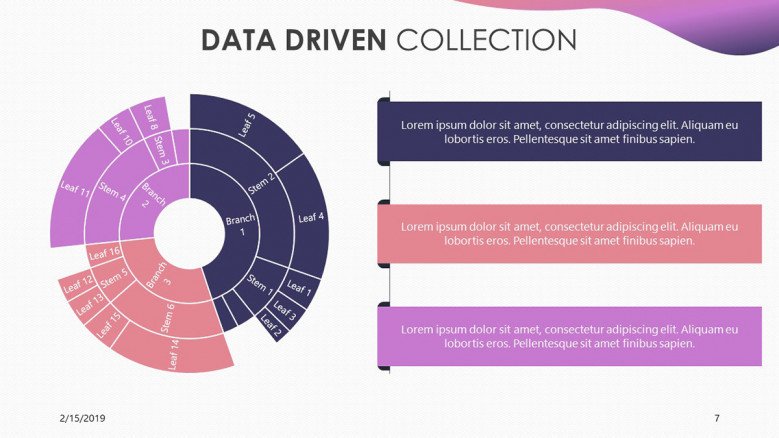
Treemaps are great for showcasing how multiple elements fit together to form a wider role. A common use case for treemaps is to represent the budget allocated to different departments and units within the company. Each branch would represent the budget allocated for a department, such as IT or Marketing, and each leaf would be a unit within the wider department.
Data is Information
Extract valuable information out of data with analysis techniques
Information is Knowledge
Interpret the information in order to gain an understanding of your situation
Knowledge is power
Leverage your knowledge to make good decisions for your business



FIND OUT MORE ABOUT OUR CUSTOM DESIGN SERVICES
Check out other similar templates
Todd Speranzo
VP of Marketing at Avella
"24Slides helps us get PowerPoints on-brand, and improve overall design in a timeframe that is often “overnight”. Leveraging the time zone change and their deep understanding of PowerPoint, our Marketing team has a partner in 24Slides that allows us to focus purely on slide content, leaving all of the design work to 24Slides."
Gretchen Ponts
Strata Research
"The key to the success with working with 24Slides has been the designers’ ability to revamp basic information on a slide into a dynamic yet clean and clear visual presentation coupled with the speed in which they do so. We do not work in an environment where time is on our side and the visual presentation is everything. In those regards, 24Slides has been invaluable."
Nyah Pham
Novozymes
"After training and testing, 24Slides quickly learnt how to implement our CVI, deliver at a high quality and provide a dedicated design team that always tries to accommodate our wishes in terms of design and deadlines."