


Great slides, delivered to your inbox
Join thousands of professionals who get our best presentation tips, new templates, and design inspiration from the 24Slides team. Plus, if you ever need a fully custom deck — we’ll be a click away.

Reset your Password
Please enter the email you registered with and we will send you a link to reset your password!
Check your email!
We’ve just sent you a link to . Please follow instructions from our email.


Venn Diagrams have stood the test of time. They are a great tool for expressing logical information in a visual and easily understandable way. Venn diagrams are versatile and can be used to express many types of ideas and data points. This slide deck has been designed to offer you multiple types of Venn diagrams to allow you the flexibility of expressing all your ideas clearly and intuitively. Use slides such as the Four Data Set Diagram, the Multiple Overlaps Data Set and the Transition Period Diagram.
This modern take no the Venn diagram offers a unique perspective on the diagrams. The color combination between multiple data sets and the hexagonal shapes are easily memorable and will help your presentation attendees to keep focused an express additional interest into this visually captivating diagram.
An umbrella term contains a lot of terms, many of which can belong to additional data sets as well. Using this chart can enable you to find commonalities between data sets which might seem initially unrelated.
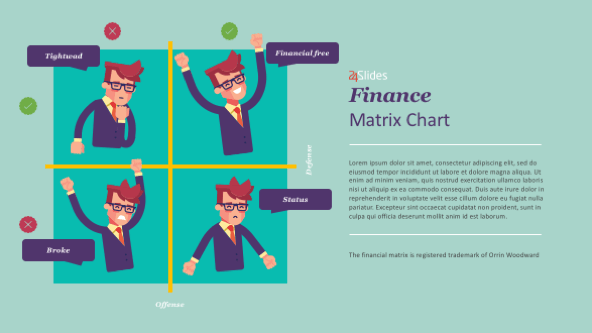
This slide offers a unique take on the traditional Venn diagram and can be used to represent the transition period between two phases of a project. In theory, a delivery phase starts as soon as the previous one finishes. But in reality, there is a transition period where sanity checks and other types of controls take place. This slide is excellent for explaining this concept in an easily understandable, visual manner.
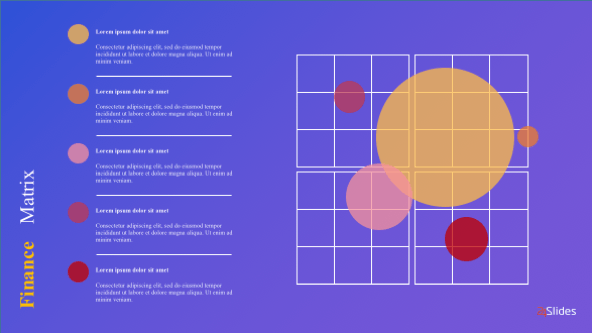
Understand relationships between data sets
Venn diagrams are a great way to visualize relationships
Paint a picture for your stakeholders
Easily explain how concepts are interrelated
Identify opportunities
A visual representation can shine a new light on old perspectives


FIND OUT MORE ABOUT OUR CUSTOM DESIGN SERVICES
Check out other similar templates

 69 fully
editable
slides
69 fully
editable
slides

Todd Speranzo
VP of Marketing at Avella
"24Slides helps us get PowerPoints on-brand, and improve overall design in a timeframe that is often “overnight”. Leveraging the time zone change and their deep understanding of PowerPoint, our Marketing team has a partner in 24Slides that allows us to focus purely on slide content, leaving all of the design work to 24Slides."
Gretchen Ponts
Strata Research
"The key to the success with working with 24Slides has been the designers’ ability to revamp basic information on a slide into a dynamic yet clean and clear visual presentation coupled with the speed in which they do so. We do not work in an environment where time is on our side and the visual presentation is everything. In those regards, 24Slides has been invaluable."
Nyah Pham
Novozymes
"After training and testing, 24Slides quickly learnt how to implement our CVI, deliver at a high quality and provide a dedicated design team that always tries to accommodate our wishes in terms of design and deadlines."