


Great slides, delivered to your inbox
Join thousands of professionals who get our best presentation tips, new templates, and design inspiration from the 24Slides team. Plus, if you ever need a fully custom deck — we’ll be a click away.

Reset your Password
Please enter the email you registered with and we will send you a link to reset your password!
Check your email!
We’ve just sent you a link to . Please follow instructions from our email.


The revenue is one of the most important metrics along the sales and cash flows of your firm. Therefore, it is of utmost importance to appropriately present it in front of shareholders, managers and investors. This template is created upon organization and efficiency. It enables you to save time, but still deliver the most informative presentation in front of your audience.
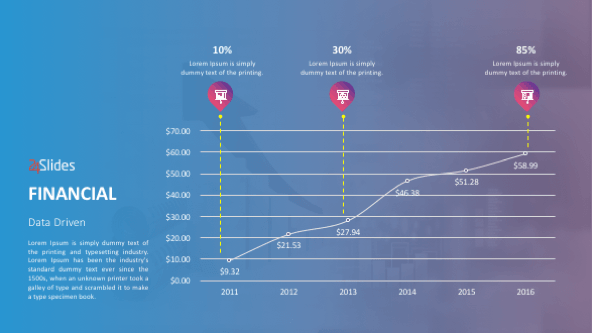
There is no better representation of the revenue than with the Line Chart. As you know, the line chart connects multiple data points with straight line segments. The basic purpose of the revenue line chart is to measure or compare revenue numbers through time. You can compare this year’s revenue to last year’s, or to the budget, on monthly basis. Also, you can measure the value of the revenue against to the EBIT. This is especially useful because you can determine the operating expenditures and see if the revenue can cover the interest and the tax.
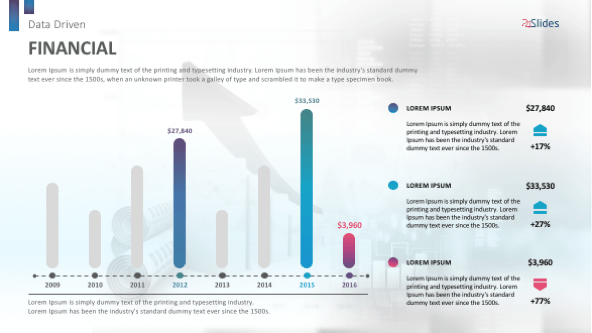
The vertical graph bar can be easily customized to show income, revenue and tax values. It is useful for comparing different datasets throughout time. The time units are expressed on the x-axis in years, months, days and even minutes. One disadvantage of the vertical bar graphs is that there is not enough space for text labeling on the x-axis.
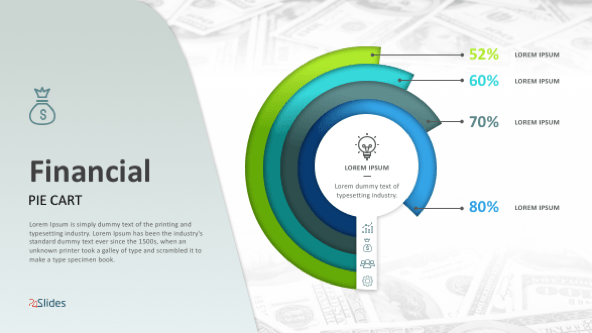
Companies, whose revenue is driven by data, have multifold higher revenue than those who are solely based on intuition and past experiences. In order to introduce your audience to the idea behind your revenue results, you can use the pie chart. You can express your revenue as a part of the overall cash flows. Also, you can break down revenue based on occurrence in time and show how much of this month’s revenues contribute to the yearly revenue.
Use Line Charts to measure and compare revenue numbers throughout time
You will be able to easily present numerous data points in different period of time.
Template design that enables you to create the presentation in a matter of minutes
Simple template that can be prepared quickly and will contribute for an efficient presentation.
Easy-to- follow and appropriate for making good impressions in front of shareholders, managers and investors
A template for creating a striking presentation that will capture the audience’s attention.


FIND OUT MORE ABOUT OUR CUSTOM DESIGN SERVICES
Check out other similar templates

 69 fully
editable
slides
69 fully
editable
slides


Todd Speranzo
VP of Marketing at Avella
"24Slides helps us get PowerPoints on-brand, and improve overall design in a timeframe that is often “overnight”. Leveraging the time zone change and their deep understanding of PowerPoint, our Marketing team has a partner in 24Slides that allows us to focus purely on slide content, leaving all of the design work to 24Slides."
Gretchen Ponts
Strata Research
"The key to the success with working with 24Slides has been the designers’ ability to revamp basic information on a slide into a dynamic yet clean and clear visual presentation coupled with the speed in which they do so. We do not work in an environment where time is on our side and the visual presentation is everything. In those regards, 24Slides has been invaluable."
Nyah Pham
Novozymes
"After training and testing, 24Slides quickly learnt how to implement our CVI, deliver at a high quality and provide a dedicated design team that always tries to accommodate our wishes in terms of design and deadlines."