If your company operates at the innovative end of the spectrum, then research and development is an inevitable part of your business. The whole decision-making process involved in the research and development actions is quite complex. It also requires a lot of time and material resources and a technical know-how, as well. Therefore, this template will enable you to create a well-structured presentation for your audience and you will make a great impression upon investors. Raising additional fund to continue the project will be a piece of cake.
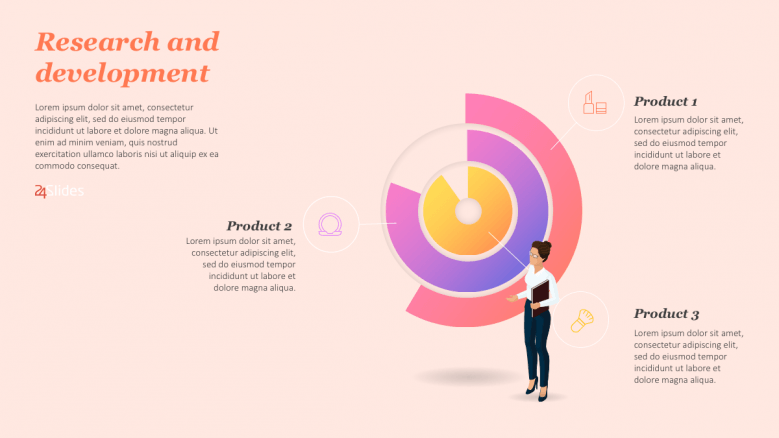
Pie Charts are here to represent different proportions of the whole. It can be used how adding new products to your existing line of products will impact your overall budget. You can show exactly how much of the total budget will be distributed to the development of the new product. Also, if you want to improve existing products, you can show how much out of the total budget you will need.
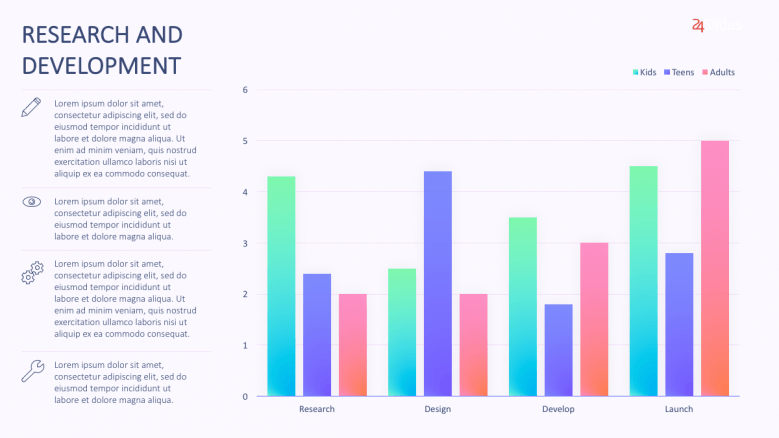
The vertical bar chart is great when you want to compare different categories. You can group different customer categories and see how they will impact each stage of the research and development process. Your product may be suitable for younger and older customers and each of them will contribute differently to the research, design, development and launch stage.
Each company that conducts a proper data analysis has better chances of improving its overall profitability. Therefore, driven by data, the business can produce more relevant outputs regarding its decision-making on research and development. It is also important to look at the bigger picture, such as the industry in which it is going to operate. Comparing regions will yield a better understanding of the business operations.
Successful presentation for raising additional funds for research and development actions
Contributes for a well-structured presentation that will make a great impression on the investors.
Creating visual and reliable pie charts for budget distributions
The pie charts will represent different proportions of the whole and can be suitable for effective analyses in different departments.
Reliable and data driven analysis of the whole industry
By conducting proper analysis, you can improve the overall profitability of your company.


FIND OUT MORE ABOUT OUR CUSTOM DESIGN SERVICES
Check out other similar templates
Todd Speranzo
VP of Marketing at Avella
"24Slides helps us get PowerPoints on-brand, and improve overall design in a timeframe that is often “overnight”. Leveraging the time zone change and their deep understanding of PowerPoint, our Marketing team has a partner in 24Slides that allows us to focus purely on slide content, leaving all of the design work to 24Slides."
Gretchen Ponts
Strata Research
"The key to the success with working with 24Slides has been the designers’ ability to revamp basic information on a slide into a dynamic yet clean and clear visual presentation coupled with the speed in which they do so. We do not work in an environment where time is on our side and the visual presentation is everything. In those regards, 24Slides has been invaluable."
Nyah Pham
Novozymes
"After training and testing, 24Slides quickly learnt how to implement our CVI, deliver at a high quality and provide a dedicated design team that always tries to accommodate our wishes in terms of design and deadlines."