How to Create a Funnel Diagram in PowerPoint (+ FREE Templates)
Funnel diagrams or funnel charts are one of the best tools to visually represent a wide range of data. They definitely are a significant improvement over text-dense slides and can be an excellent resource for your business presentations.
With our easy-to-follow guide, you'll learn how to create a funnel diagram in PowerPoint in no time. So… let's get into it!

Or, you can jump to your preferred section:
- What is Funnel Chart in PowerPoint?
- How do I make a funnel chart in PowerPoint?
- Easiest Way To Create Funnel Graphic for PowerPoint: Use Templates
- How to Create PowerPoint Funnel Graphics Using Shapes
- How to Create Funnel Chart in PowerPoint With SmartArt
- PowerPoint Funnel Variations
- Horizontal Funnel PowerPoint Graphic
- How to make a 3D funnel in PowerPoint
- Expert Tips to Design the Best PowerPoint Funnel Diagram Slides
- Check Out The Best Funnel PowerPoint Templates [FREE Download]
- Master the Art of Marketing Data Presentation Your Vision, Our Expertise
Starting with the basics: What is Funnel Chart in PowerPoint?
A funnel chart is a data visualization tool that shows how data moves through a process. It is often used when the data goes through a series of stages, and there is a clear reduction in each of them, as it is in sales funnels, sales management, order fulfillment, and recruitment.
Visually, the data in the stages is reflected in horizontal bars, organized in decreasing order, creating a funnel-like shape. Here’s an example:
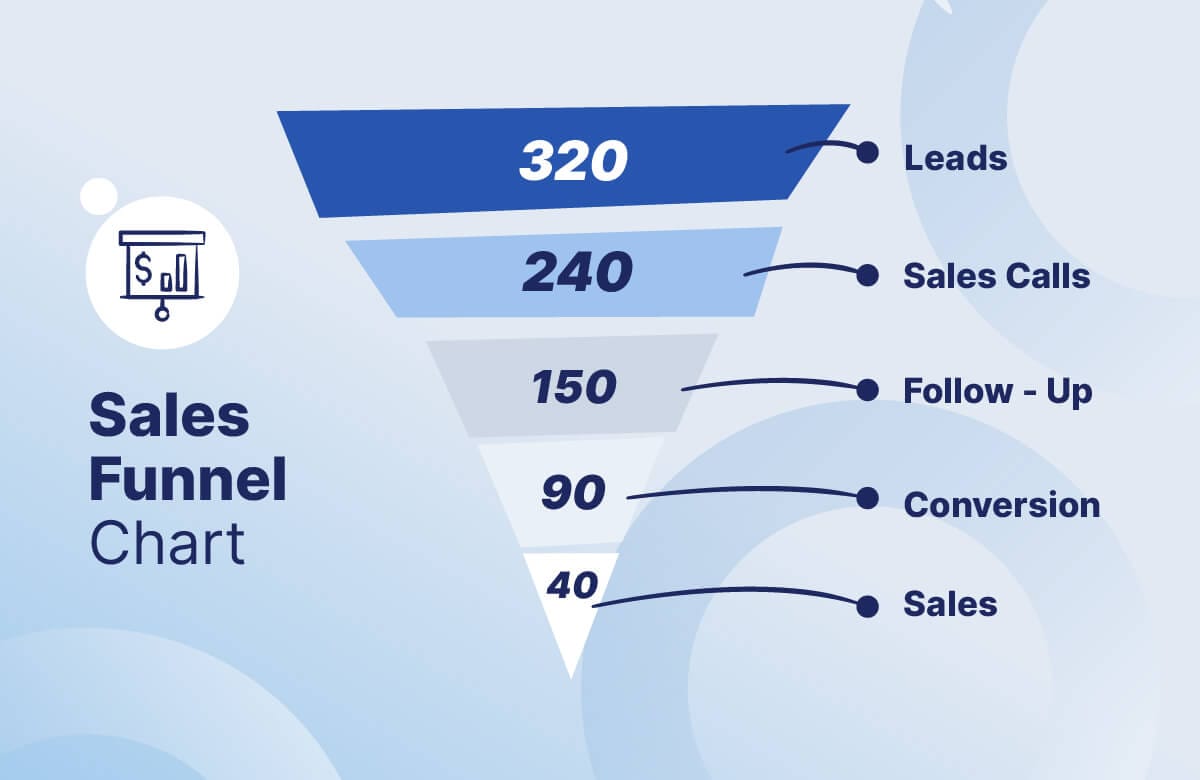
As you can see, the sales funnel is one of the best examples of when to use this type of chart. It allows the team to see the progression in each stage and identify areas where they can improve to optimize their sales process.
You can create a sales funnel diagram using various tools, such as Microsoft Excel, PowerPoint, and more. However, PowerPoint does offer some additional benefits when trying to showcase your date. For example, it allows you to create completely customized funnel charts, allowing you to tailor the chart's appearance to match your branding or any style you want.
How do I make a funnel chart in PowerPoint?
Making a funnel chart in PowerPoint is extremely easy! You can create them in three different ways: using templates, shapes, and SmartArt. Let’s take a look at each one of them:
Easiest Way To Create Funnel Graphic for PowerPoint: Use Templates
The easiest way to create a funnel diagram is to use a template. Luckily, at 24Slides, we have many funnel slide templates at your disposal. And guess what? You can download them for free!
Check out: 24Slides Funnel PowerPoint Template Free Download

The best thing about using templates? You can customize them as you wish, write your content, put your brand's colors, and add any other branding elements. Essentially, you'll have a tailor-made funnel presentation without the need to start from scratch. It's quick, easy, and guarantees a seamless, professional, and creative outcome.
Now, let’s check out the step-by-step of editing a funnel PowerPoint template:
- Sign up for free on Templates by 24Slides to access and download all templates.
- Choose the funnel design template that best suits your needs.
- Download the template, open the presentation, and click on the funnel slide.
- Click on a text box to select the existing text, then type in your content. Repeat this step until you have written all your content.
- Make any other changes: Add your branding or any other design elements.
And you're done!
How to Create PowerPoint Funnel Graphics Using Shapes
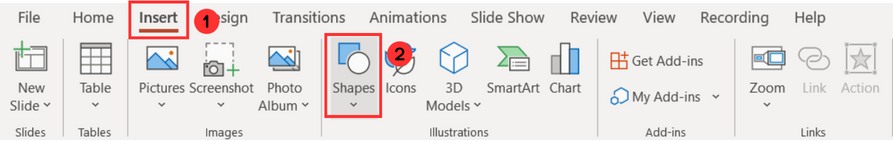
Go to the Insert Tab, click Shapes, and insert a trapezoid shape.
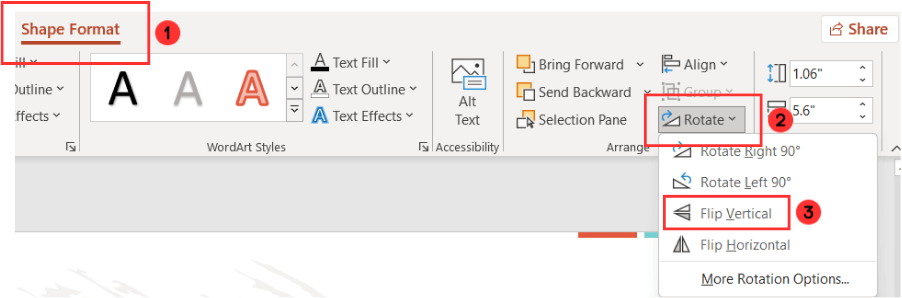
Now, you need to rotate it so the thinner part faces downward. Go to the Shape Format Tab, select Rotate, and click Flip Vertical.
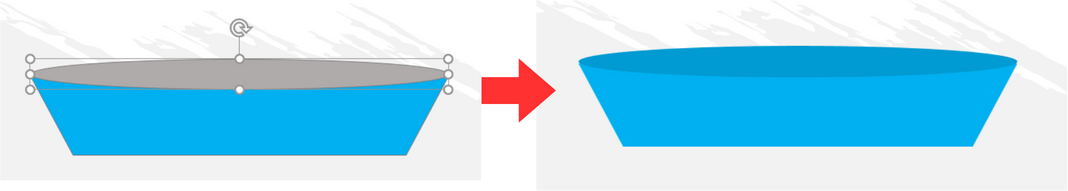
At this point, you should be able to see an inverted trapeze:

The next step is to insert a circle and adjust its size to fit on top of the inverted trapezoid. Choose a darker shade for the circle compared to the trapezoid for a better visual effect.
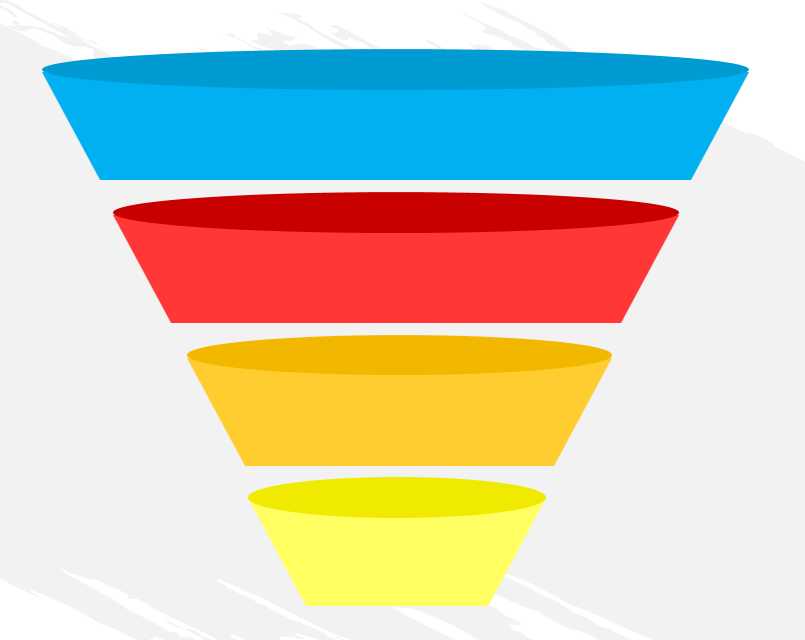
Then, select the shape you created and press Ctrl+D to duplicate the shape as many times as the number of stages you have. Adjust their size and position to create the funnel-like shape, and select the color of your choice for them. The result will be something like this:
How to Create Funnel Chart in PowerPoint With SmartArt
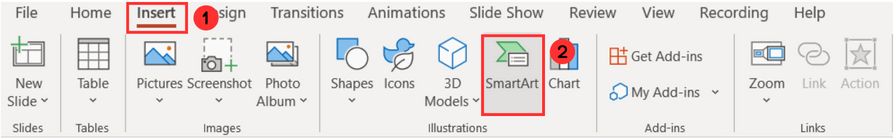
Go to the Insert Tab and click on SmartArt.
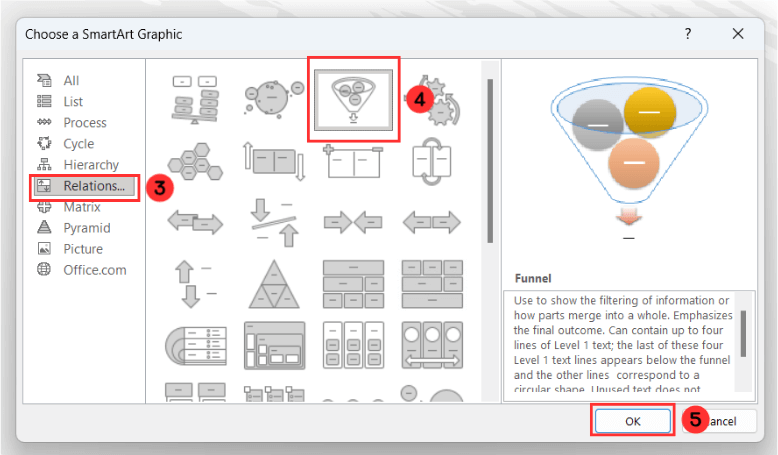
Choose the Relationship section. Then, select the Funnel Diagram and click Ok to add it to your presentation.
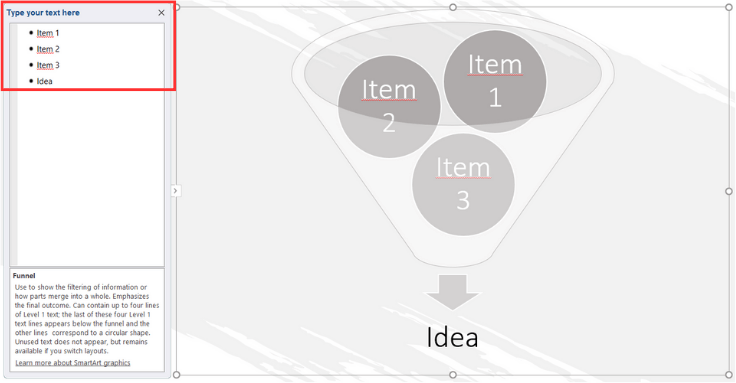
Now, you'll see a funnel graphic added to your presentation and, next to it, a text box with bullet points. The first three bullet points represent the items inside the funnel, and the fourth represents the summarizing idea. Edit the text box to include your content.
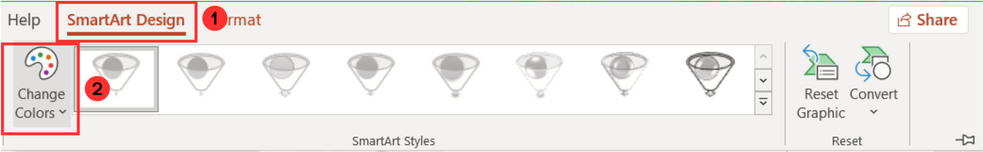
Finally, edit the graphic to match your branding. To change the colors, go to the SmartArt Design tab and select Change Colors.
PowerPoint Funnel Variations
There are many ways to portray a funnel graphic besides the ones we've already seen. Some of the most common variations are the Horizontal Funnel and the 3D Funnel. Let's see how to create them in PowerPoint.
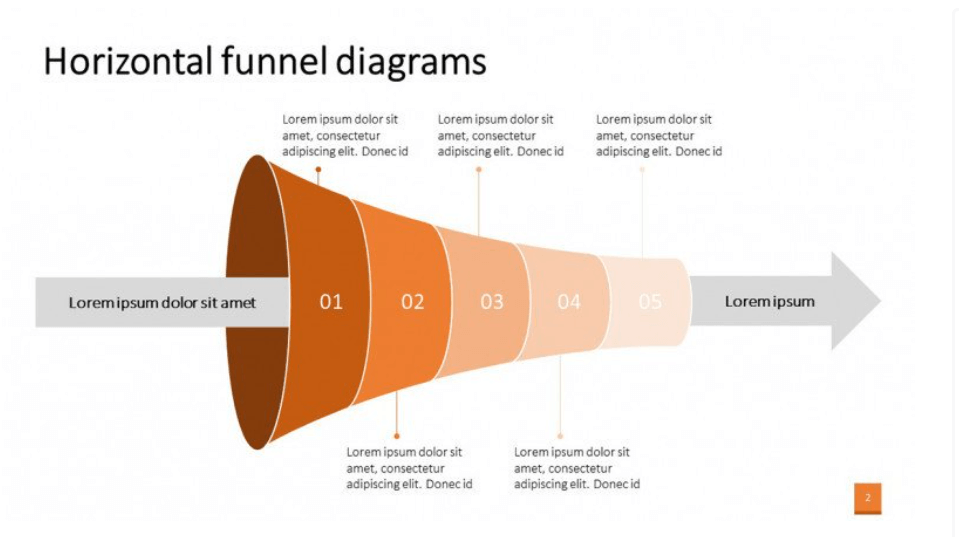
How to Create a Horizontal Funnel PowerPoint Graphic
Follow these steps to create a horizontal funnel PowerPoint graphic:
First, go to the Insert Tab, click Shapes, and insert a trapezoid shape.

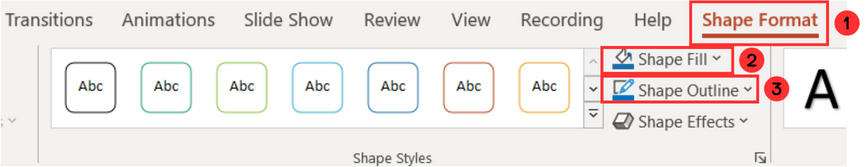
Then, select the color you want it to be and remove the outline. Go to Shape Format, and select Shape Fill and Shape Outline to make the changes.
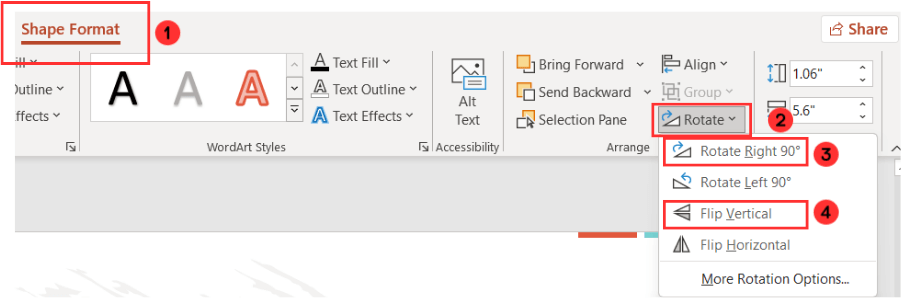
Now, in the same Tab, click Rotate, then Rotate Right 90° and Flip Vertical.
You should be able to see this shape:

You can use the yellow button to make the smaller part of the trapezoid even steeper.
The next step is to insert a circle and adjust its size to fit the wider part of the trapezoid. Choose a darker shade for the circle compared to the trapezoid for a better visual effect, and remove the outline.
Now, insert another circle and adjust its size to fit the smaller part of the trapezoid. Make it the same color as the trapezoid, and then remove the outline.
Repeat the process to create as many shapes as the number of stages you have or want. Adjust their size and position to create the funnel-like shape, and select the color of your choice for them. The result will be something like this:

How to make a 3D Funnel in PowerPoint
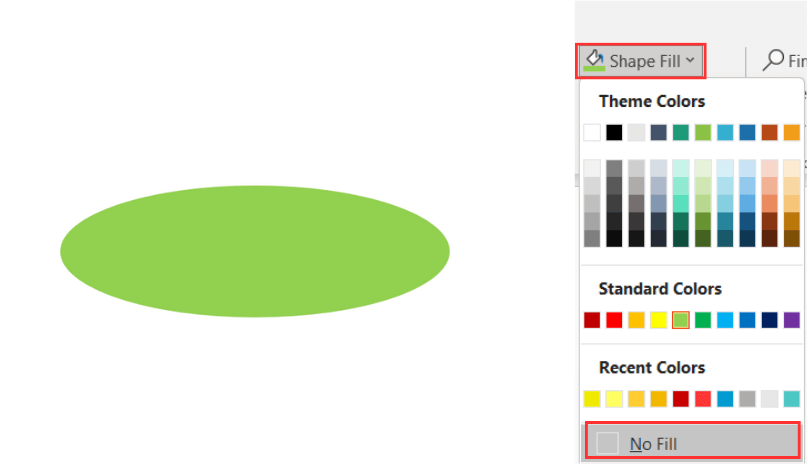
Go to the Insert Tab, click Shapes, and insert a Circle. Now, in the Shape Format Tab, click on Shape Fill and select No Fill.
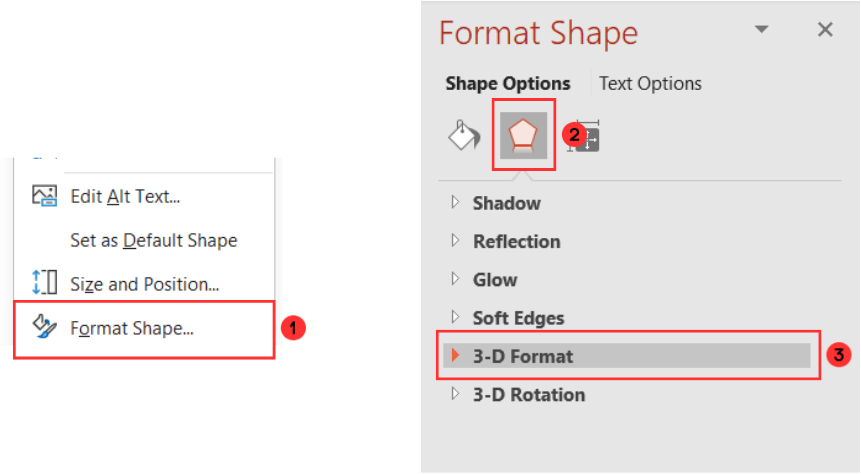
The next step is to select the shape, right-click, and choose Format Shape. Then, select Shape Options and open the dropdown menu for 3-D Format.
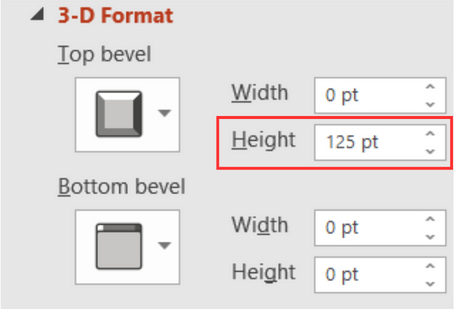
In that section, you will see the measurements for your shape, both for the Top Bevel and the Bottom Bevel. You just need to focus on the Height of the Top Bevel, experimenting with values between 80-125 pt., and adjust as needed. Make sure the rest of the measurements are set as 0pt.
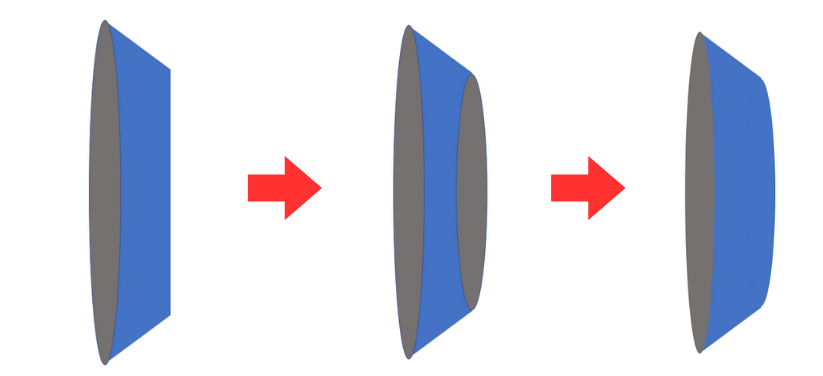
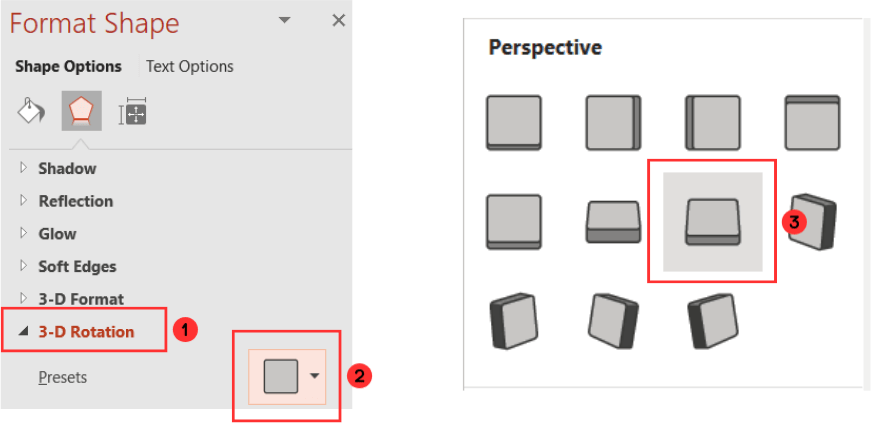
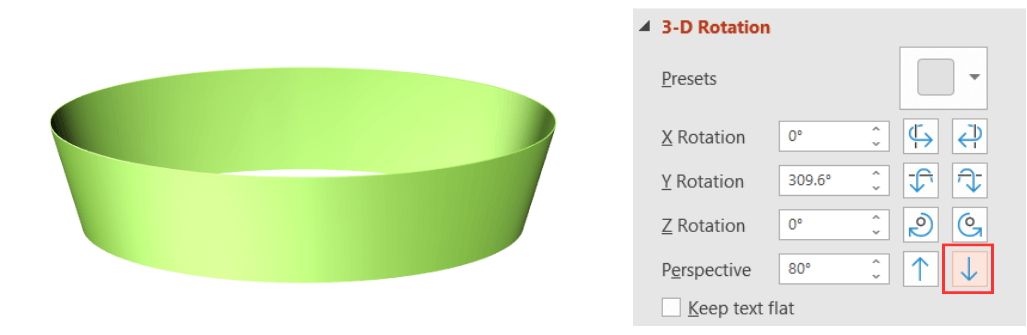
Now, close the dropdown menu for 3-D Format and open the one for 3-D Rotation. Open the Presets options and select Perspective: Relaxed.
You’ll be able to see your 3-D shape. In case you want the bottom part to be smaller so the funnel shape is more pronounced and steep, go back to the 3-D Rotation dropdown menu. Under Perspective, click the down arrow until you achieve your desired shape.
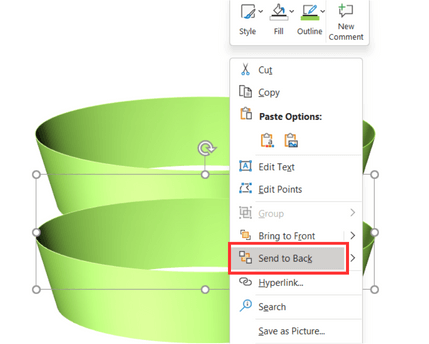
The next step is to duplicate the shape as many times as you have stages or as many times as needed to achieve your desired visual effect. Press Ctrl+D to duplicate it, then right-click and choose Send to Back. Repeat this process until you have the number of shapes you need.
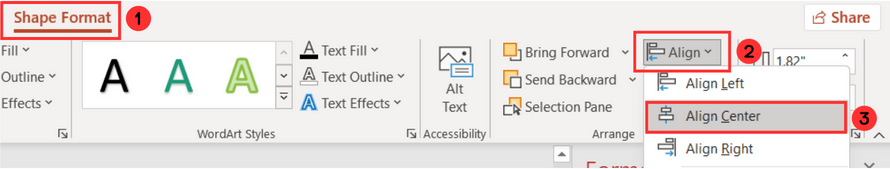
Now, adjust their size and position to create the funnel-like shape, and select the color of your choice for them. And finally, to align them, go to the Shape Format tab, select Align, and click on Align Center.
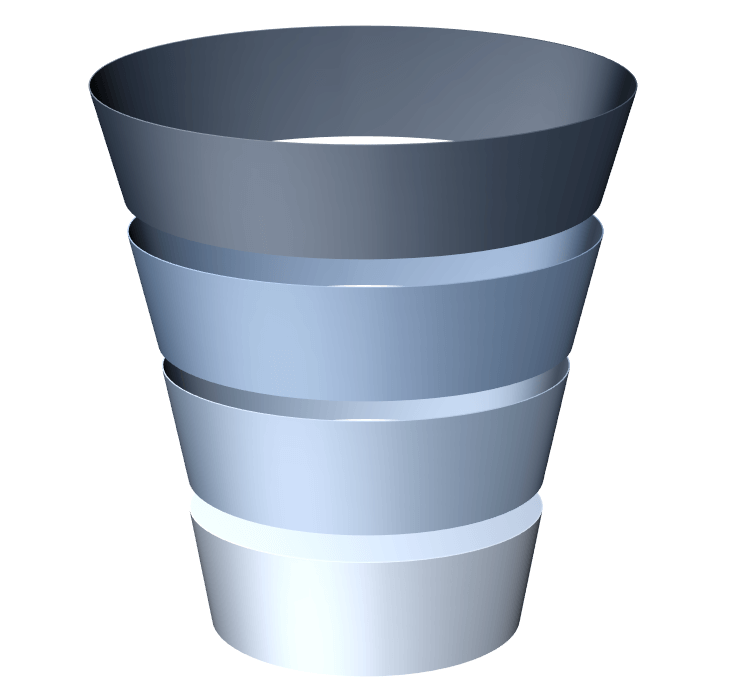
The result will be something like this:
Expert Tips to Design the Best PowerPoint Funnel Diagram Slides
Now that you've learned how to create funnel diagrams, we'll give you the secrets to make them look professional and create a lasting impression on your audience. Let’s take a look at some insights from expert designers.
Tip #1: Keep it simple and clear
The key for data visualization tools is that they should be practical. They should help you visualize something that is going on in your business, not add more confusion. So make sure your labels are clear and have just the right information. Don’t try to include ALL your data; instead, use speaker notes to have it available.
Tip #2: Consider the colors you’ll use
Remember that this is a presentation you’ll do for an audience, so they should be able to tell the difference between the bars or stages. So, when designing the funnel, consider how it will be seen from the screen you’ll be presenting, and choose colors that will support your presentation. However, keep in mind the importance of using your brand colors to maintain brand consistency.
Tip #3: Think about the number of stages
When creating funnel charts for presenting data, it’s essential to consider the number of stages in your process. Funnel charts are most effective when you have data that passes through at least three stages. If your process has fewer stages, it might be more appropriate to use other types of charts, like pie charts or bar charts.
Check Out The Best Funnel PowerPoint Templates [FREE Download]
Ready to create amazing funnel diagrams? Here are 6 of the best funnel chart PowerPoint Templates for your next project. And what’s best, you can download them for free!
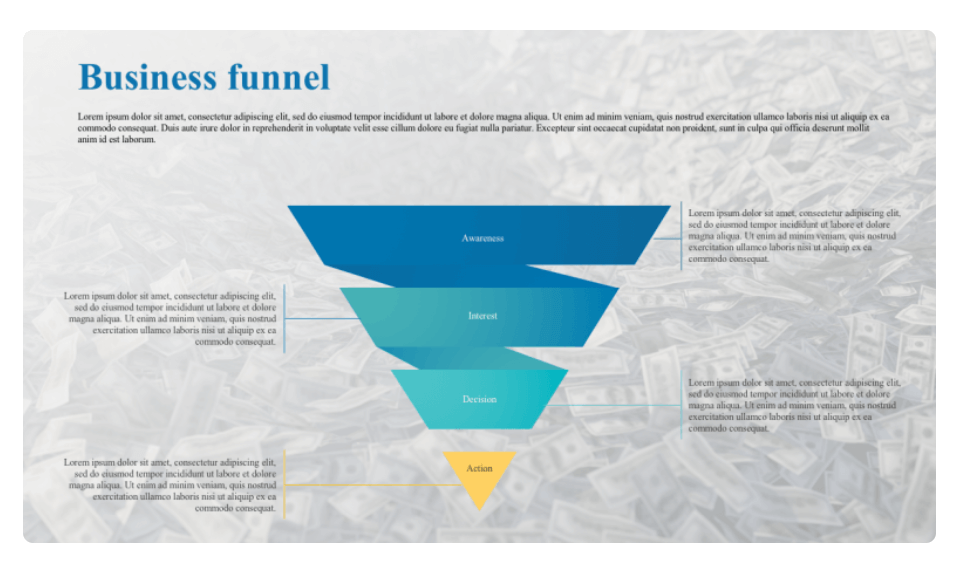
Business Funnel Presentation Template
Check out this Business Funnel Presentation Template. If you want to create a professional, corporate, yet creative presentation, this design could be the perfect fit.
Funnel Slide Template
If you want a simple but professional funnel slide design, this template is for you. Download it for free!
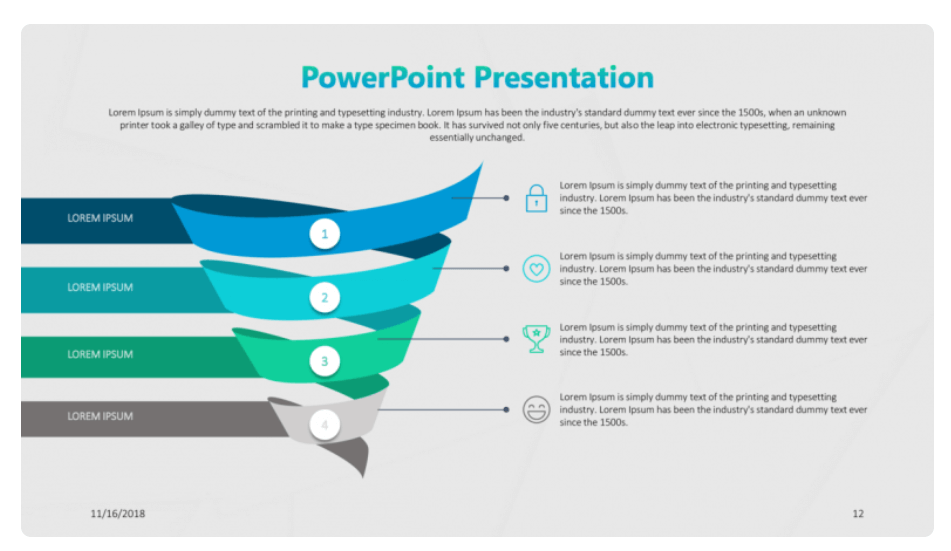
Ribbon Funnel PowerPoint Template
If you’d like a visually appealing and creative template, this ribbon funnel template is for you. Download it for free, and adapt it to your needs: change its colors, typography, content, and more!
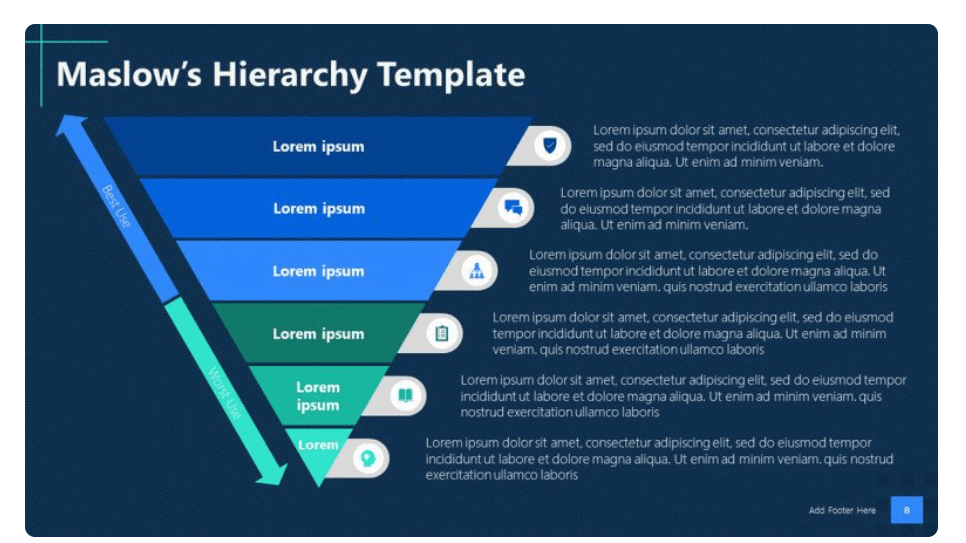
Corporate Hierarchy Template
If you want to display information in different levels or categories that follow an order of importance, our Corporate Hierarchy Template will come in handy to explain each section piece by piece.
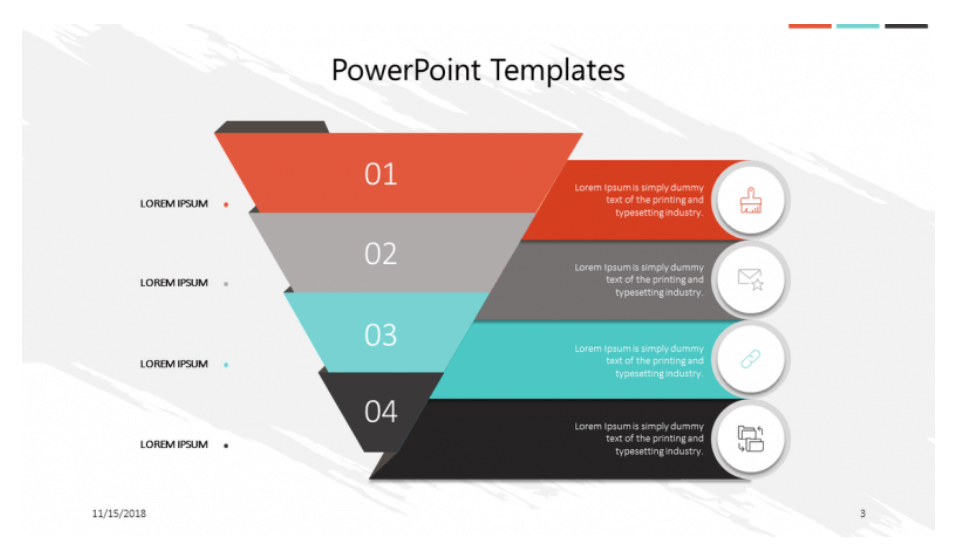
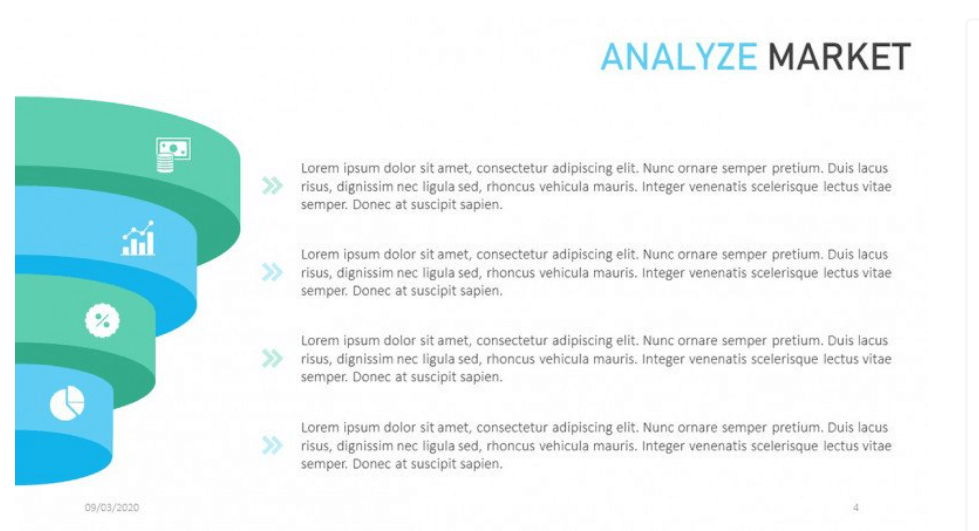
4 Step Color Funnel Design PowerPoint Template
Check out this Marketing Analysis PowerPoint Presentation as a starting point for amazing marketing initiatives! It includes not only a market analysis funnel template, but also many visual tools and appealing slides for your next business presentation.
Free Editable Horizontal Funnel PowerPoint Template
The best thing about funnel charts is that you can easily customize them to what you’re working on. For example, email conversions, e-commerce checkouts, b2b sales, etc. And what’s best? This presentation includes 8 different funnel templates you can choose from!
Check out more Free Funnel PowerPoint Templates:

Master the Art of Marketing Data Presentation: Your Vision, Our Expertise
Data presentation is a big deal in business presentations, especially when you want to impress an audience or close deals. How you present your data, the tools you use, and how it all looks can make a big difference in how your audience sees you – it can turn an okay presentation into a great one.
So…don't take chances with data presentation; let the experts handle it! Our designers are here to help. Just tell us whatever you need – your ideas, content, branding – we'll take care of it all. You'll be amazed by the results. Ready to give 24Slides a try?