How to Make a Flowchart in Google Slides (+ Free Templates)

Have you heard about flowcharts? They're a really cool way to visualize the sequence of steps, actions, and processes. Best of all, creating and using one in your presentation is easy!
In this article, you'll learn how to create a flowchart in Google Slides like a pro.
We’ll explore your options, from inserting a premade flowchart diagram to creating one from scratch. You’ll also learn how to insert a flowchart from PowerPoint and how to edit it in Google Slides.
Keep scrolling for step-by-step instructions, or use the screenshots and GIFs to create the perfect flowchart for your Google Slides presentation!

Here are the topics we'll cover:
- What is a Flowchart?
- How to Create a Flowchart in Google Slides
- How to insert a flowchart from another Google Slides presentation
- How to add a flowchart from PowerPoint to Google Slides
- How to Edit a Google Slides Flowchart
- Make your ideas shine with the help of 24Slides
What is a Flowchart?
A flowchart is a visual representation that uses symbols and lines to illustrate a step-by-step process. It shows and outlines the actions needed to reach specific goals.
Flowcharts show how steps fit into a process, making them useful for managing processes and presenting data. However, they’re also great for anything that needs steps in chronological order.
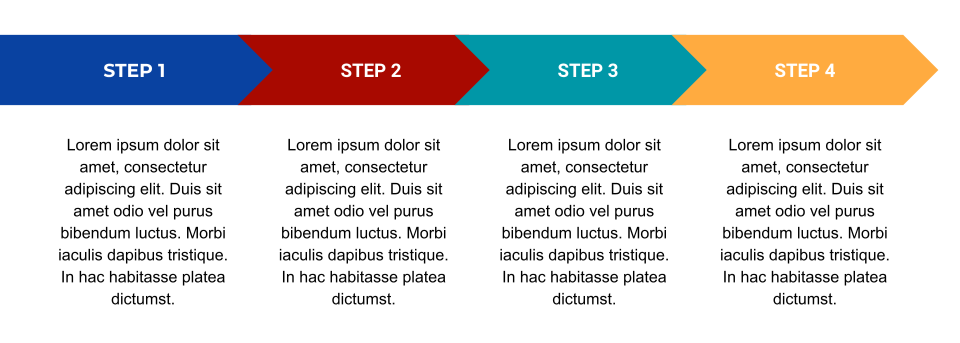
Imagine you're planning your next digital marketing strategy. A flowchart outlines every step, from crafting the right content to picking the best delivery method. This ensures your marketing is clear, efficient, and strategically on point.
Here’s an example:

How to Create a Flowchart in Google Slides
You have two options for creating a flowchart in Google Slides: Use a premade diagram or create one from scratch with shapes and arrows.
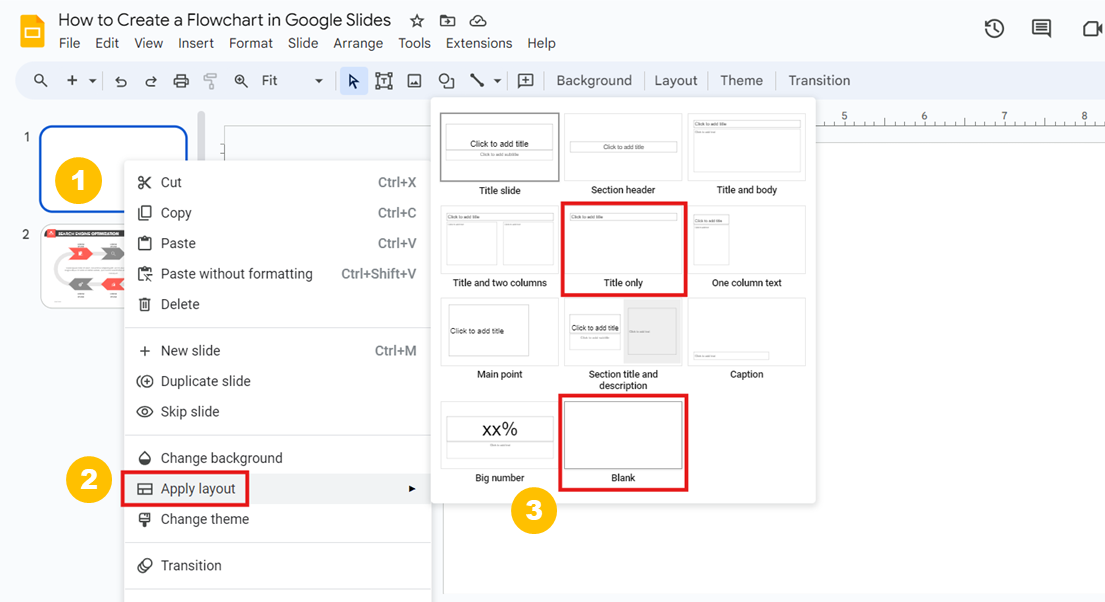
Before we begin, it's best to start with a blank canvas or just a slide with a title text box.
- Right-click on the thumbnail image of your slide on the left side of your screen, and you’ll get an options menu for it. Go to Apply layout, and pick either the Blank or Title Only option.
Now you’re ready to begin creating your Flowchart in Google Slides!
Use Google Slides premade diagrams
This is the easiest and most convenient way to create a flowchart in Google Slides.
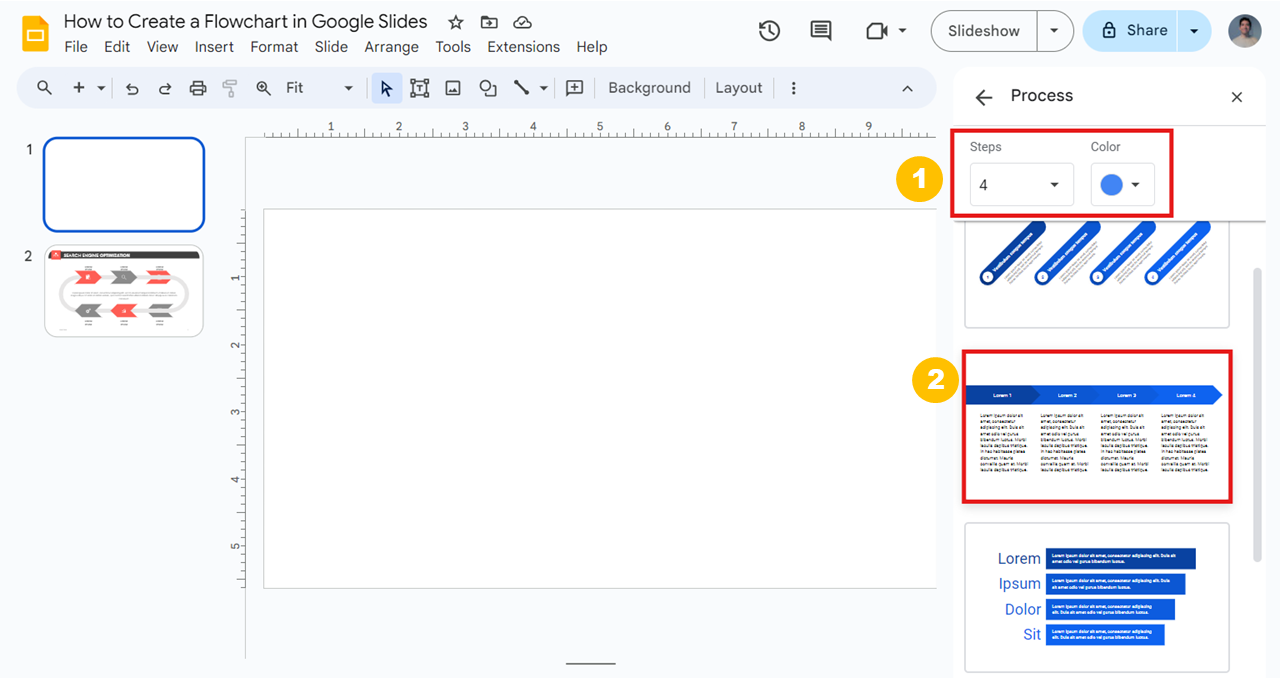
- Step 1: In Google Slides, go to Insert > Diagrams. This will open a secondary window on the right side of your screen. Select the Process option here. You’ll get five different designs for a process diagram.
You can choose from designs like steps, pyramids, and linear diagrams. For circular or repeating processes, check out the Cycle option.
- Step 3: Once you’ve found your favorite design, you can customize your flowchart before adding it to your slides. You can add up to 5 steps and change colors to match your presentation.
After customizing your flowchart, click your preferred design to insert it into your slides.
- Step 4: Add your content to your flowchart by clicking on the text boxes and typing your text.
- Step 5: Customize your Google Slides flowchart. Now, you can further edit your flowchart. Change the font, style, and color of the text. You can also customize the shapes by selecting each one.
And there you have it—a nice Google Slides flowchart for your next presentation. From here, you have many options to customize it.
Later, you’ll find more information on how to edit your flowchart in Google Slides. Stay tuned!
Create a flowchart from scratch using Google Slides
Using Google Slides' premade diagrams is the easiest way to create a flowchart. But is it always the best option? Not really.
Imagine a company needs to map out a unique and complex process for its workflow. Premade diagrams might miss key details, so creating a custom flowchart is necessary.
Creating a flowchart from scratch will give you more control, allowing you to design just as you want.
Pro tip: “Sketching simplifies the process if you make a flowchart from scratch. This can help better organize the content within the space.” Carmen Navarrete/ Expert Designer
For this example, we will create a classic flowchart of processes and decision-making.
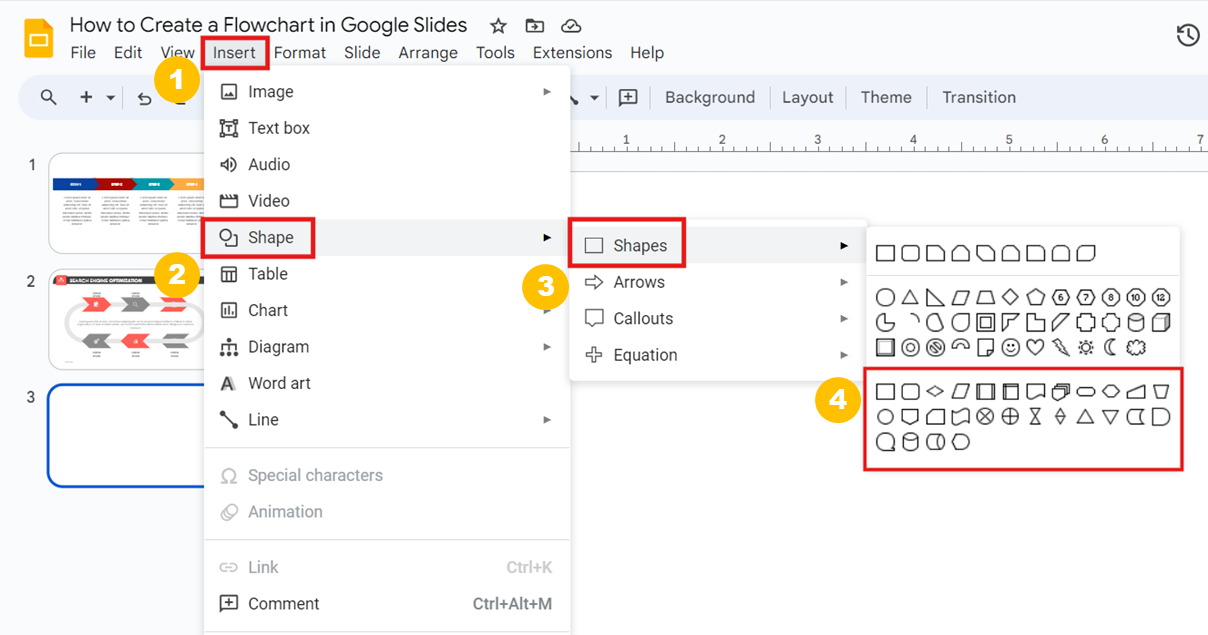
- Step 1: Go to Insert > Shape > Shapes. At the bottom, you’ll find many shapes you can use to convey the steps of your flowchart.
Keep in mind that each shape has a different meaning. We’ll use the following:
An oval symbolizes the start or end of a process.
A rectangle represents a process and outlines the main steps.
A diamond marks decision points within the process.
Fortunately, a brief description pops up when you hover your mouse over each option.
- Step 2: Select an oval and double-click it to add it to your slide. Type in your content to add it automatically to the shape.
You can use the anchor points to alter your shape. To resize the shape while keeping its proportions, hold the Shift key.
- Step 3: Keep adding shapes and content to build a flowchart for decision-making. The great thing about creating your own flowchart is that you can combine different shapes to fit your needs.
- Step 4: Place the shapes correctly to make your flowchart. Click and drag any shape to move it. Use the guides to align your shapes properly.
You can duplicate the rectangle (process) since we will use it three times.
- Step 5: Add lines to convey the step-by-step feel of a flowchart.
Go to the Insert tab and choose Line. Here, pick the one that best fits your needs. For this example, we’ll use the following options: Line and Elbow Connector.
Use the shape’s anchor points to make it fit your other shapes.
- Step 6: Customize your flowchart. Change the colors of shapes, adjust the lines around them, modify the font, and select design styles for the arrows.
Ensure your presentation has a cohesive style to maintain brand consistency. This will make your flowchart look more polished and professional.
If you need some inspiration, I'll explain later how to edit your Google Slides flowchart like a pro.
How to insert a flowchart from another Google Slides presentation
You don't always need to create a flowchart in Google Slides from scratch. Hundreds of free Google Slides templates are available to enhance your presentations.
The great thing is you don't have to waste time searching. Our Templates by 24Slides platform offers amazing free Google Slides flowchart templates.
Once you have the perfect Google Slides flowchart, adding it is easy!
- Step 1. Open the document with the flowchart you want to use. In the thumbnail section on the left, right-click the flowchart slide and select Copy.
- Step 2. Go to your presentation’s thumbnail section and right-click > Paste to add the flowchart slide to your presentation.
- Step 3. A format window will pop up when you paste your flowchart. This offers you different options:
Choose "Keep original styles" to keep the slides as they are. To blend the imported slide with your presentation’s style, pick "Match styles in this presentation."
Google Slides also offers a third choice: "Link & Keep Original Styles." This option lets you link back to the original presentation, making it easy to show where you got it from.
How to add a flowchart from PowerPoint to Google Slides
What happens if the flowchart you want to use is not in Google Slides? You can find hundreds of free flowchart templates, but it's more likely that these will be in PowerPoint format.
To use a flowchart from PowerPoint, you’ll need to convert it first to a Google Slides document. This is also pretty easy but’ll take a few extra steps.
- Step 1: Open your Google Drive account and go to New > File Upload. Once you’ve found the PowerPoint file you want to use, double-click it. A loading bar will appear in the lower right corner to show the upload progress.
- Step 2: Once the upload is complete, click on it to open it. The PowerPoint presentation will open in Google Slides. This version is editable; you can use it like any other Google Slides presentation.
- Step 3: With this version, you can work on your PPT document as if it were a Google Slides file. However, to create a native Google Slides file, go to File> Save as Google Slides. This will make a copy of your Google Slides presentation.
And that’s it! Google Slides will now automatically convert your file.
Now you have your PowerPoint flowchart in a Google Slides format! If you want to add it to another Google Slides presentation, just follow the steps described in the previous section. All done!
How to Edit a Google Slides Flowchart
Now that you have a flowchart in your Google Slides document, it's time to edit it. As mentioned earlier, matching your flowchart's style with the rest of your slides is essential for a professional look.
You can use Google Slides tools to edit flowcharts made with diagrams, created from scratch, or imported from other presentations.
Here are the main options to customize your Google Slides flowchart:
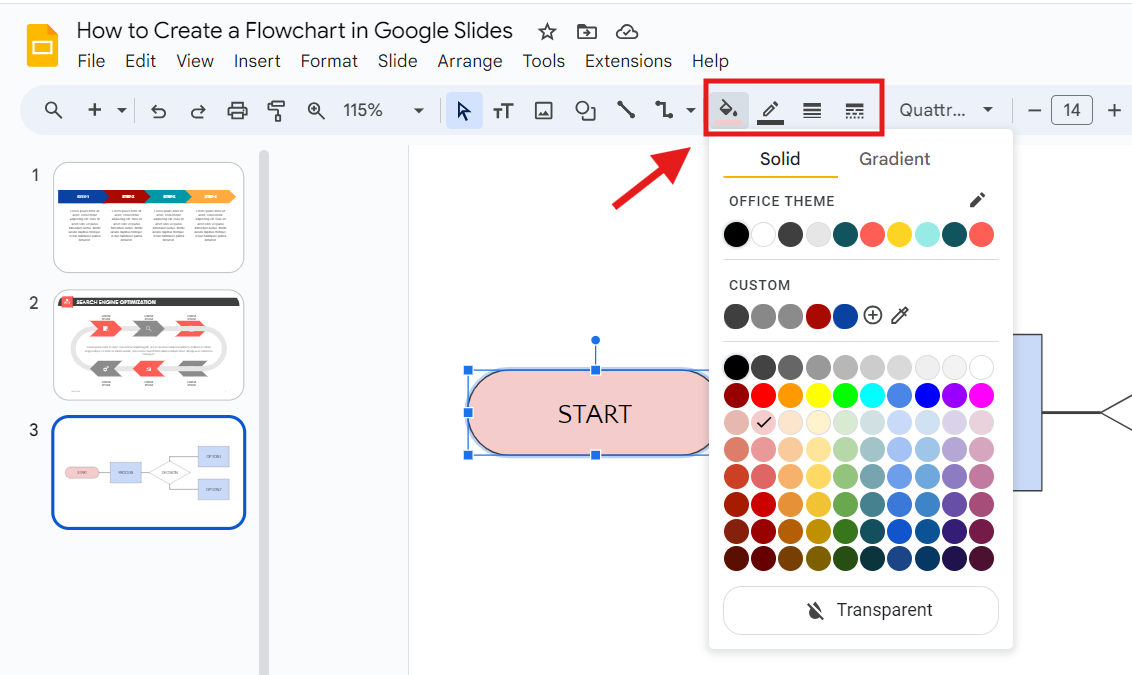
Selecting any shape will open the Shape Menu. This section allows you to customize each shape in your flowchart.
- Fill Color lets you adjust tones using solid or gradient colors. You can even make your shapes transparent!
- Border color allows you to adjust the color of shape outlines.
- Border weight gives you control over the thickness of the border lines of each shape.
- Border dash lets you choose the style of shape outlines (solid, dashed, dotted).
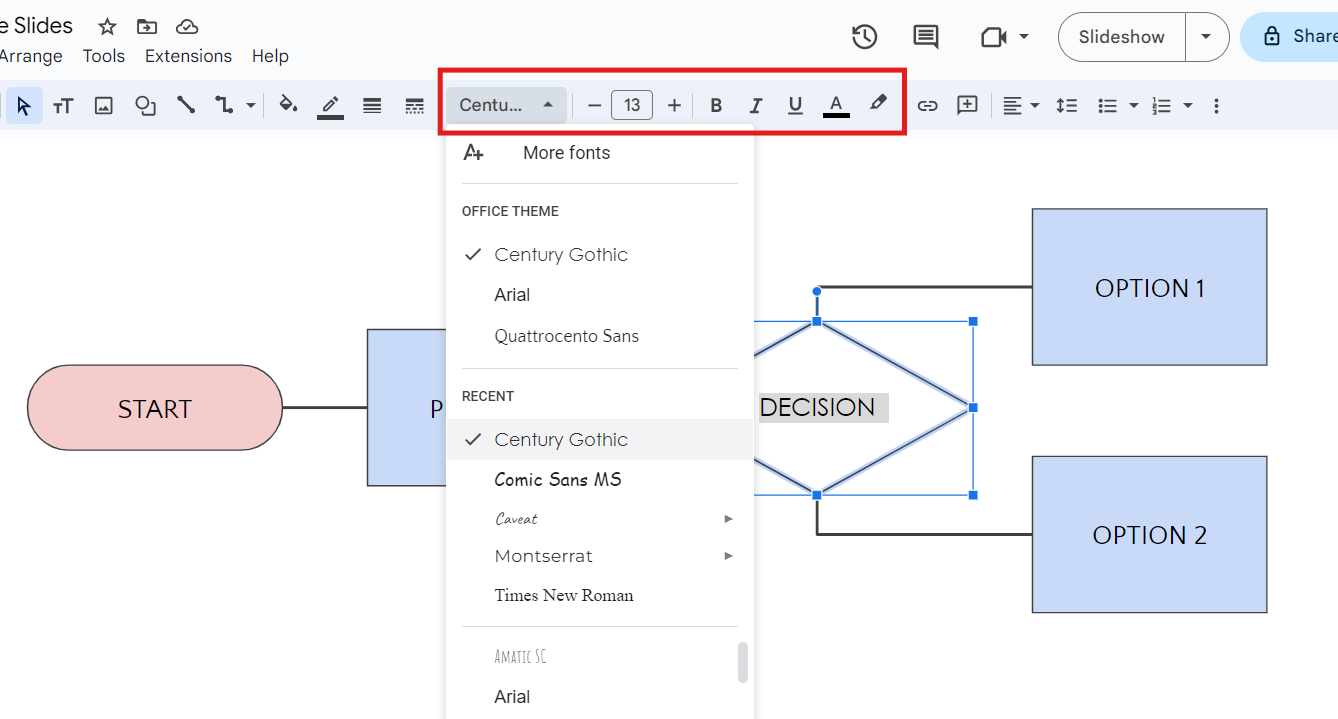
Editing the style of the text in your flowchart will enhance its appearance. Clicking on the text will open the Text Menu options.
- This option allows you to change the font, size, color, and other text styles. You can use options such as bold, italics, and text highlighting.
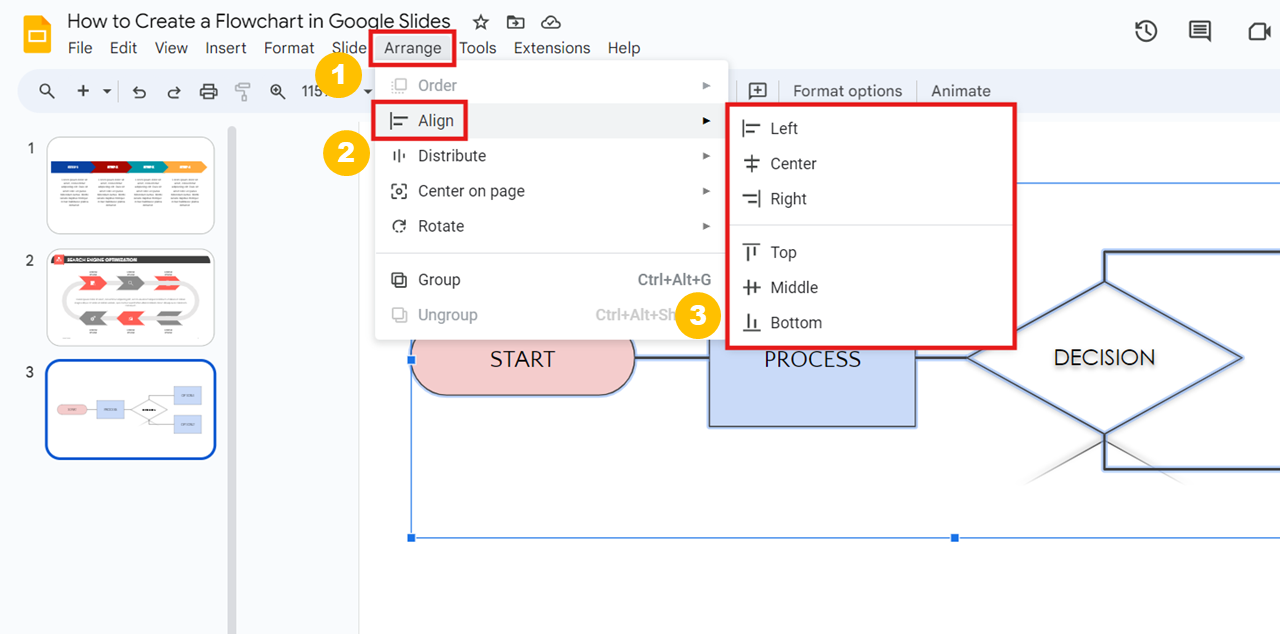
- The Arrange menu can make all the difference. It will help you make sure your shapes are all aligned with one another and equally spaced.
Here’s how to add it:
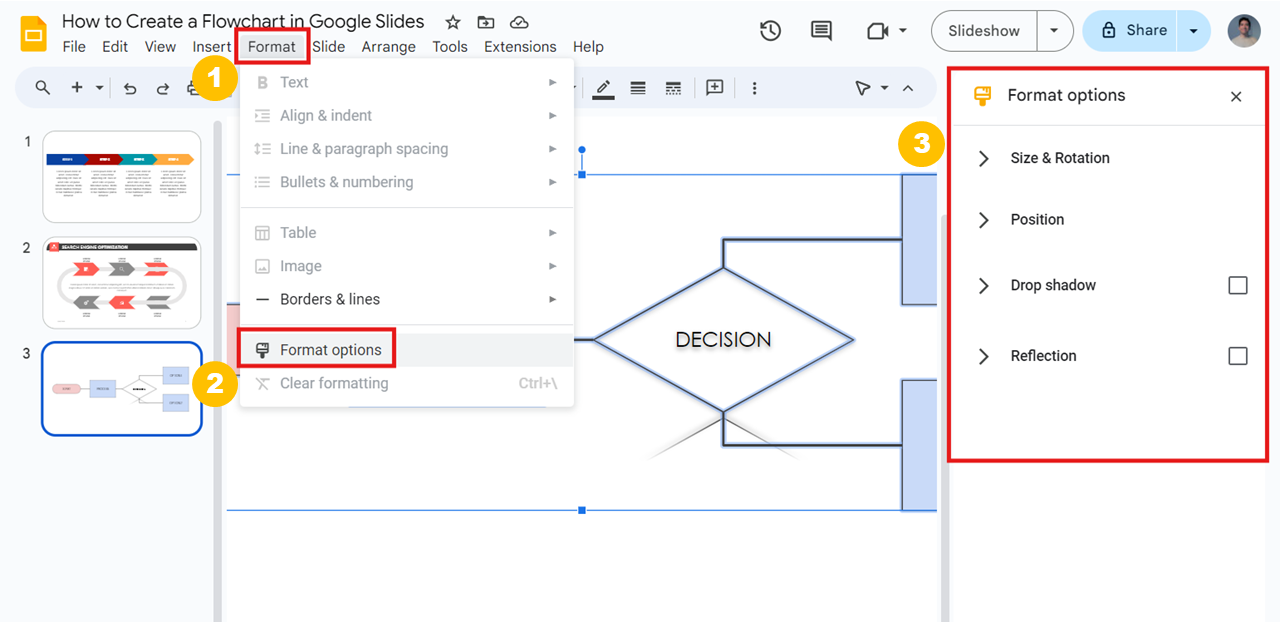
To go a step further, use the Format Options.
- Format options in Google Slides allow you to adjust visual details such as colors, styles, and spacing in your slide elements.
Go to the Format tab > Format Options. A window will appear on the right side of your screen.
If you want your flowchart to be easier to understand at first glance and more memorable for your audience, you can add icons for more visual appeal.
Hopefully, these tips will help you customize your Google Slides flowchart and make the perfect presentation!
Make your ideas shine with the help of 24Slides
We've already covered how to create and customize a flowchart in Google Slides. But if all of this seems like too much work, let professionals do it for you!
With 10+ years of experience and more than 200 designers worldwide, we are the world’s largest presentation design company across the globe.
At 24Slides, we help thousands of companies and professionals create impactful, on-brand presentations each month.
You can focus on your content while our world-class designers handle all the visuals. In less than 24 hours, you'll get a stunning presentation that perfectly represents and enhances your brand.
And the best news? You can try us out for just $1. We'll create a unique, editable one-slide presentation that perfectly captures your brand essence!

Ready to master Google Slides? Check out this content!
- Expert Tips for Creating Charts, Diagrams, and Tables in Google Slides
- Ensuring Brand Consistency: How to Make a Successful Brand Implementation Strategy
- Making a Radial Chart in Google Slides: A Step-by-Step Guide
- How to Make a Venn Diagram in Google Slides
- How to Make a Timeline in Google Slides? Guide for beginners