How to Make a Pyramid Chart in Google Slides? + Free Templates

Don't have a clue on how to present your data? If you need to organize your data in a hierarchical manner, a Pyramid Chart in Google Slides can be really useful!
By opting for the Google Slides format, you will be able to edit your Pyramid Graph in real-time and share it with your colleagues in a few minutes.
In this article, you'll learn how to make a Simple Pyramid Chart in Google Slides. Plus, a Population Pyramid in Google Slides, supported by Google Sheets!
You can check out all the content here:
- How to Make a Simple Pyramid Chart in Google Slides?
- How to Customize a Pyramid Chart in Google Slides?
- How to Make a Population Pyramid in Google Sheets?
- How to Customize a Population Pyramid in Google Sheets?
- Pyramid Templates in Google Slides: Download for free!
How to Make a Simple Pyramid Chart in Google Slides?
Are you short of time and need to make a Pyramid Chart in Google Slides? We'll explain the step-by-step here:
- Open a document in Google Slides and give it a name.
- Go to Insert > Diagram > Process.
- A control panel will open on the right side of the screen with some pre-existing designs.
- Customize the levels and the color of your pyramid with the options given by the platform.
- Go to the end of the list, and you'll find the Google Slides Pyramid Chart. When you click on it, it automatically appears on your slides!
- Finally, add all your information, and that's it!
In the upcoming section, you'll learn more about the process of creating a Pyramid Graph in Google Slides. Stay tuned and keep reading!

How to Customize a Pyramid Chart in Google Slides?
Do you want to give a touch of originality to your presentation deck?
In the following section, we'll show you how to customize a Pyramid Graph in Google Slides and build a branded presentation effortlessly:
How to Customize a Pyramid’s Colors in Google Slides?
Based on our previous Simple Pyramid in Google Slides, follow these steps to customize its colors:
- Select the pyramid and press right-click.
- Press "Ungroup" and stop selecting any item.
Now, each element of your Pyramid in Google Slides will be independent, allowing you to customize each separately.
- Select the element whose color you want to change.
- Go to "Fill Color" and select the replacement color.
A trick to change the color faster is to select several elements at the same time. To do so, you only need to:
- Press the "Control" (Ctrl) key.
- Click on every element that you want to be colored the same way.
- Repeat the step with all the elements you want and finish your design in Google Slides!
How to Customize a Pyramid’s Levels in Google Slides?
If you need to show up a lot of information and the default Pyramid Chart structure isn't enough, keep tuned.
Follow these steps to add more levels to your Pyramid in Google Slides:
- The elements of the pyramid must be ungrouped. If you don't know how to do it, see the first two steps in our previous section.
- Press the Ctrl key and select the items you are going to copy.
- Press Ctrl + C and then Ctrl +V.
- Keep all elements selected and move them down.
Now it's time to enlarge the figure to have a symmetrical Pyramid Chart in Google Slides:
- Keep all elements of the new level selected.
- Press the Shift key and select one of the border points.
- Pull the point and increase the size of the pyramid as needed. You have to test the most appropriate height for your design!
- Finally, right-click on the new level > Order > Send to back.
Fill out all your information, and you will have a custom Google Slides Pyramid!
- Tip for beginners: You can move or redesign every element of your Pyramid Diagram in Google Slides when selecting “Ungroup.” Keep in mind that you have a free pass to be creative with your final chart design!
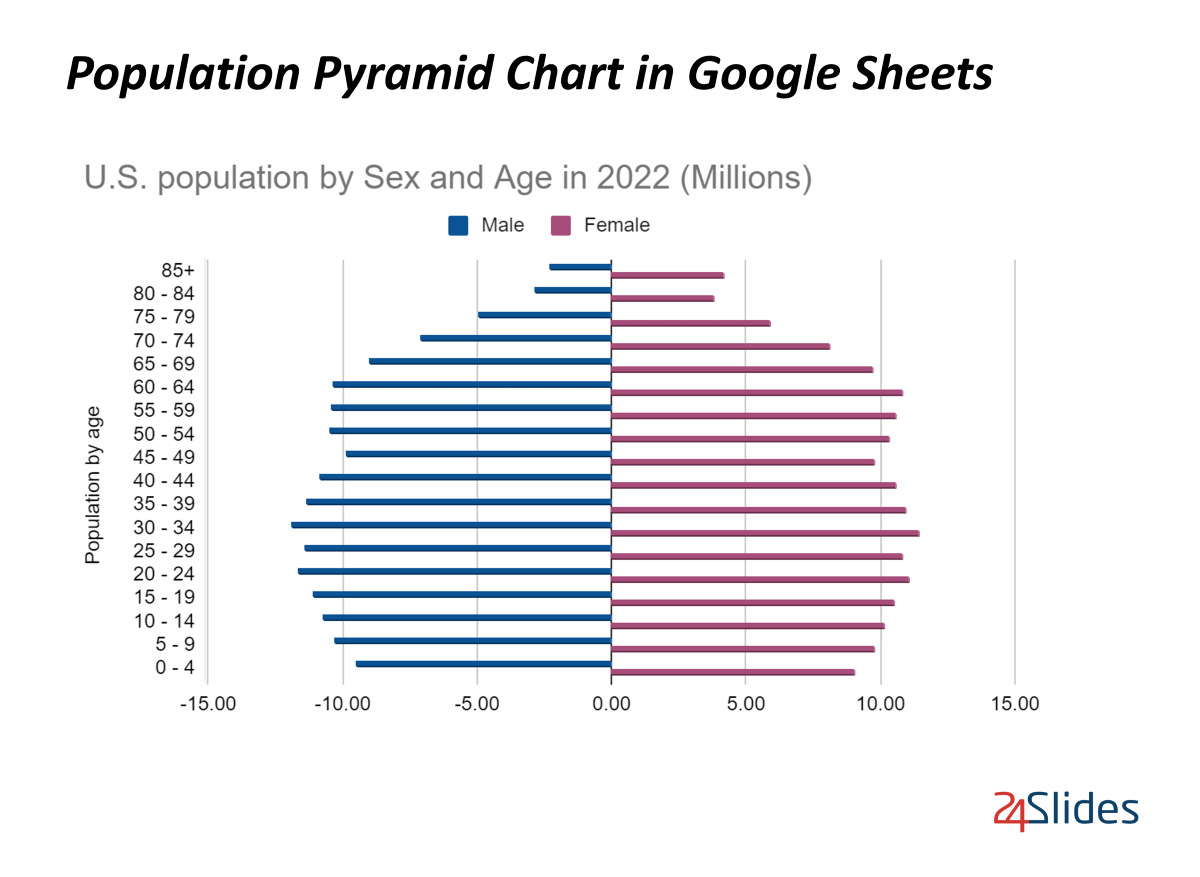
How to Make a Population Pyramid in Google Sheets?
In order to create a Population Pyramid in Google Slides, we need another Google online program: Google Sheets.
Now, we'll explain how to insert a Population Pyramid from Google Sheets into Google Slides.
We recommend you follow each step with the program running!
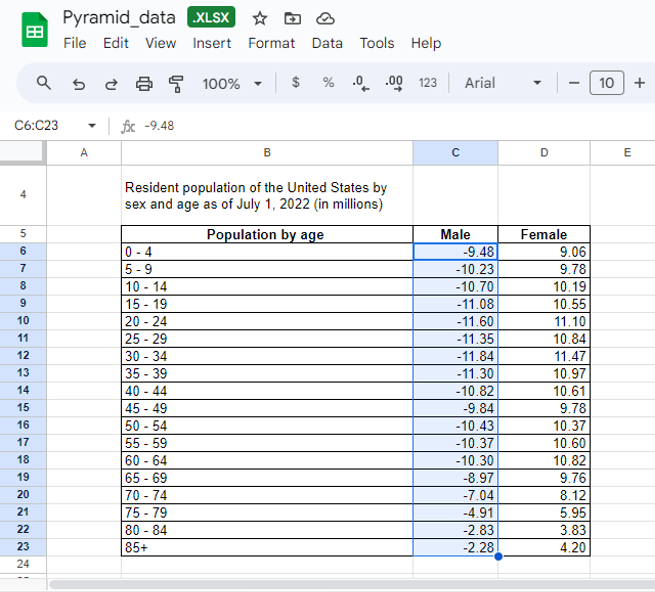
- The first step is to have all your data organized in Google Sheets. For creating a Population Pyramid, two variables are used: Age Range and Sex.
- To insert a Population Pyramid into Google Sheets, you'll need to add a negative symbol to an entire column of data (see image).
- Now select all the information from your Population Pyramid in Google Sheets.
- Go to the Insert tab and press "Chart."
Then, it's time to configure the order of your Population Pyramid's data in Google Sheets. Let's see:
- Double-click on the chart.
- A control panel will open to the right of the screen.
- Select "Customize" and go to "Vertical axis."
- Once there, check the "Reverse axis order" option. The ages of your graph will be inverted, and we can say that your Population Pyramid is almost ready!
Before inserting your new graph into Google Slides, you'll need to change the title of your Population Pyramid in Google Sheets:
- Go to "Customize."
- Then select "Chart & axis titles."
- Go to the "Chart title" option and type the title you want for your chart.
Finally, insert your Population Pyramid from Google Sheets to Google Slides:
- Select your Population Pyramid in Google Sheets.
- Press Ctrl + C.
- Go to your Google Slides document.
- Press Ctrl + V, and that's it!
We recommend you choose the "Link to spreadsheet" option to ensure that any modifications to your data are updated in your Google Slides document.
Do you want to personalize your Population Pyramid in Google Sheets? Below, we'll tell you how!
How to Customize a Population Pyramid in Google Sheets?
Now it's time to go a little deeper into how to customize a Population Pyramid in Google Sheets.
How to Customize a Population Pyramid’s Colors in Google Sheets?
To change the color of the bars, you have to:
- Double-click on the graph.
- Go to "Customize" and press "Series."
- Select the variable you want to modify and change the color you like the most!
- We encourage you to explore all the features in this section. Test and see!
How to Create a 3D Population Pyramid in Google Sheets?
Do you want to give a 3D effect to your Population Pyramid in Google Sheets? Here we explain how:
- Double-click on the chart.
- Go to "Customize" and press "Chart style."
- Check the "3D" box, and that's it!
Remember that you can insert your Population Pyramid from Google Sheets to Google Slides really quick!
If you don't know how to do it, check the last step in our section: How to make a Population Pyramid in Google Sheets.
Pyramid Templates in Google Slides: Download for free!
We want to help you optimize your design process. That's why the 24Slides team has created free editable Pyramid templates you can customize without limitations!
Download our Pyramid templates in Google Slides for free now!
In this last part, we're going to show up some of our Pyramid templates in Google Slides:
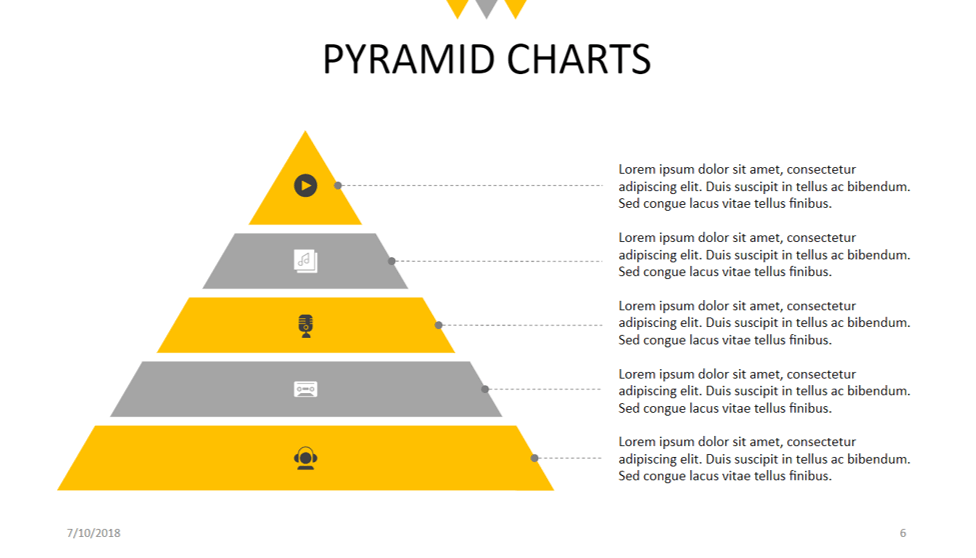
Pyramid Template in Google Slides #1
Are you looking for inspiration to organize your data? This first Pyramid template in Google Slides gives you eight different designs that you'll surely love!
Download our Google Slides Pyramid #1 here.
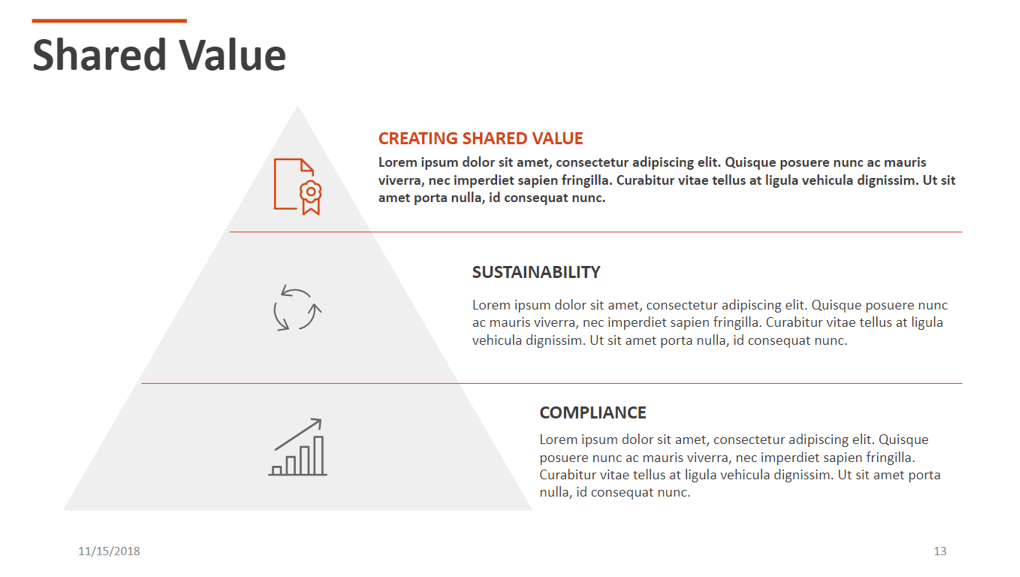
Pyramid Template in Google Slides #2
This template covers the 7S Framework, where you'll also find another Pyramid Design in Google Slides format.
Download our Google Slides Pyramid #2 here.
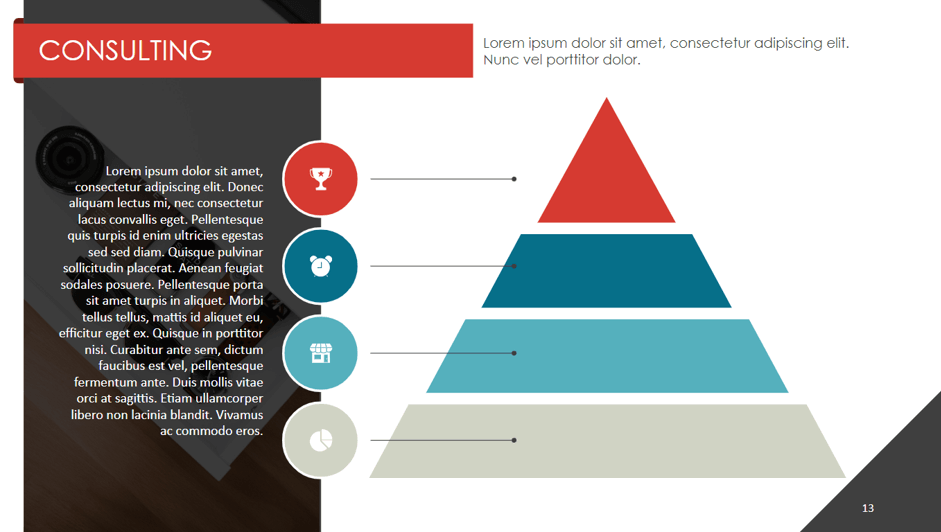
Pyramid Template in Google Slides #3
Are you a consultant and looking to impact potential clients? If so, this template in Google Slides will fit you like a glove!
Download our Google Slides Pyramid #3 here.
Pyramid Template in Google Slides #4
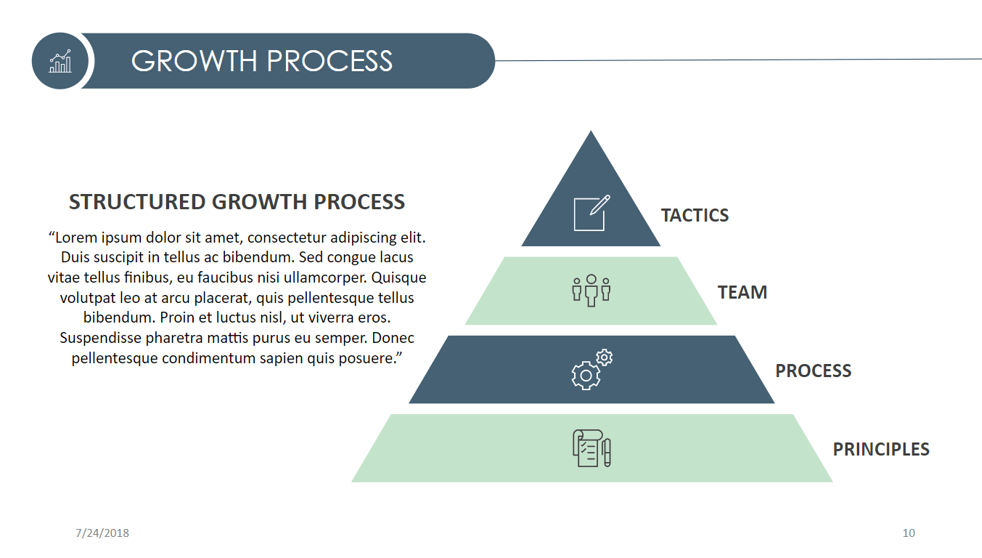
No one can deny Growth Strategies are essential in every company. If you're in charge of this strategy, our Google Slides template is your go-to solution!
Download our Google Slides Pyramid #4 here.
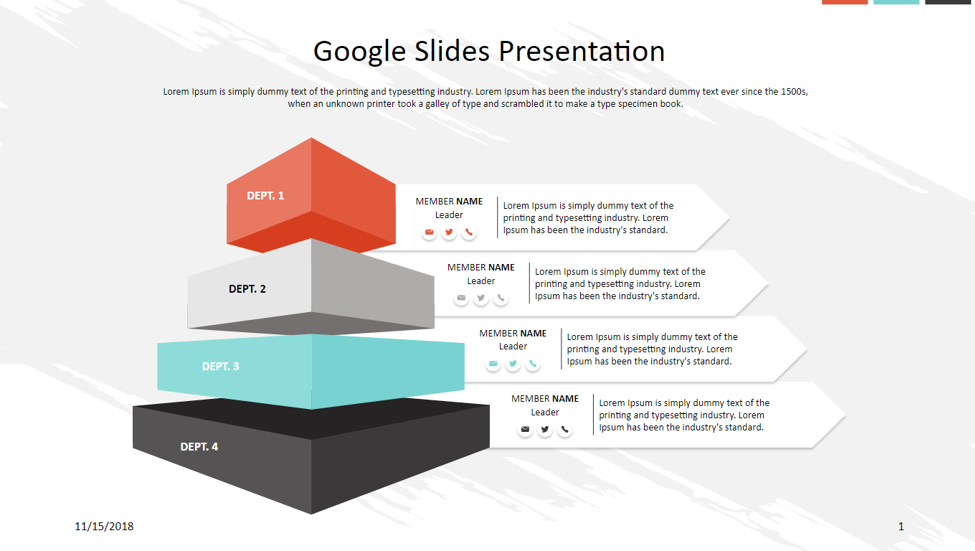
Pyramid Template in Google Slides #5
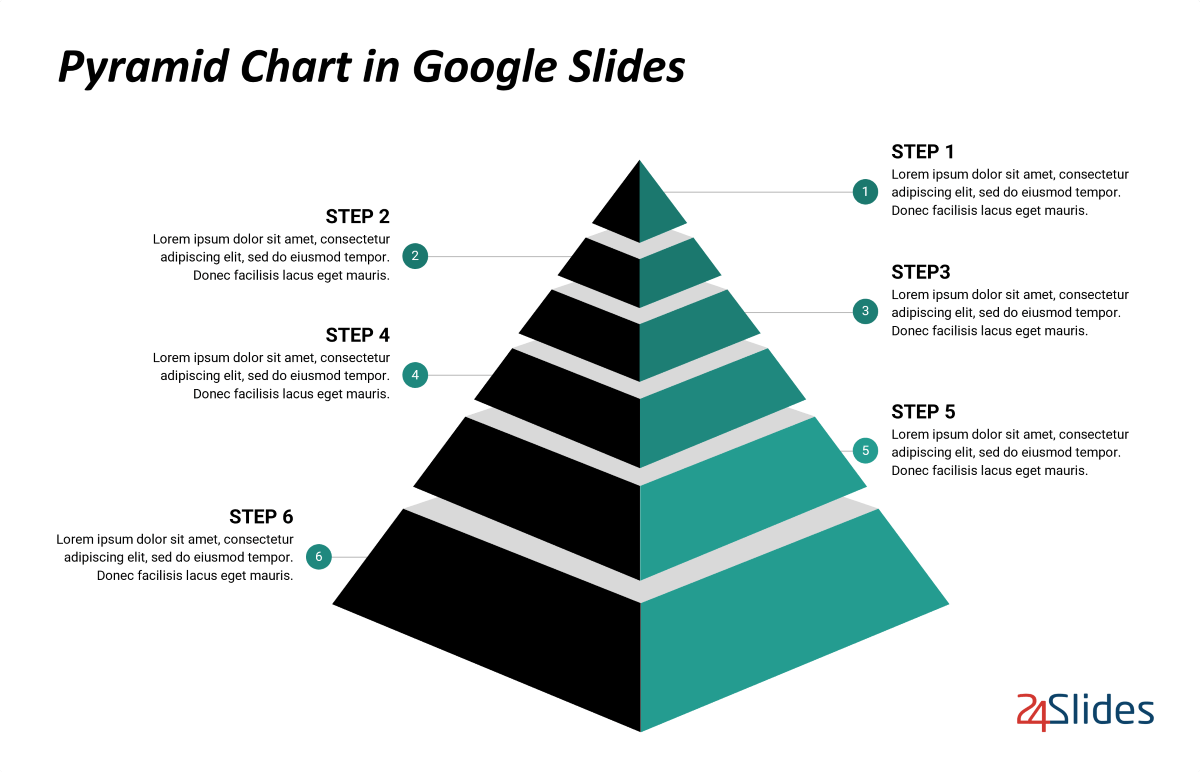
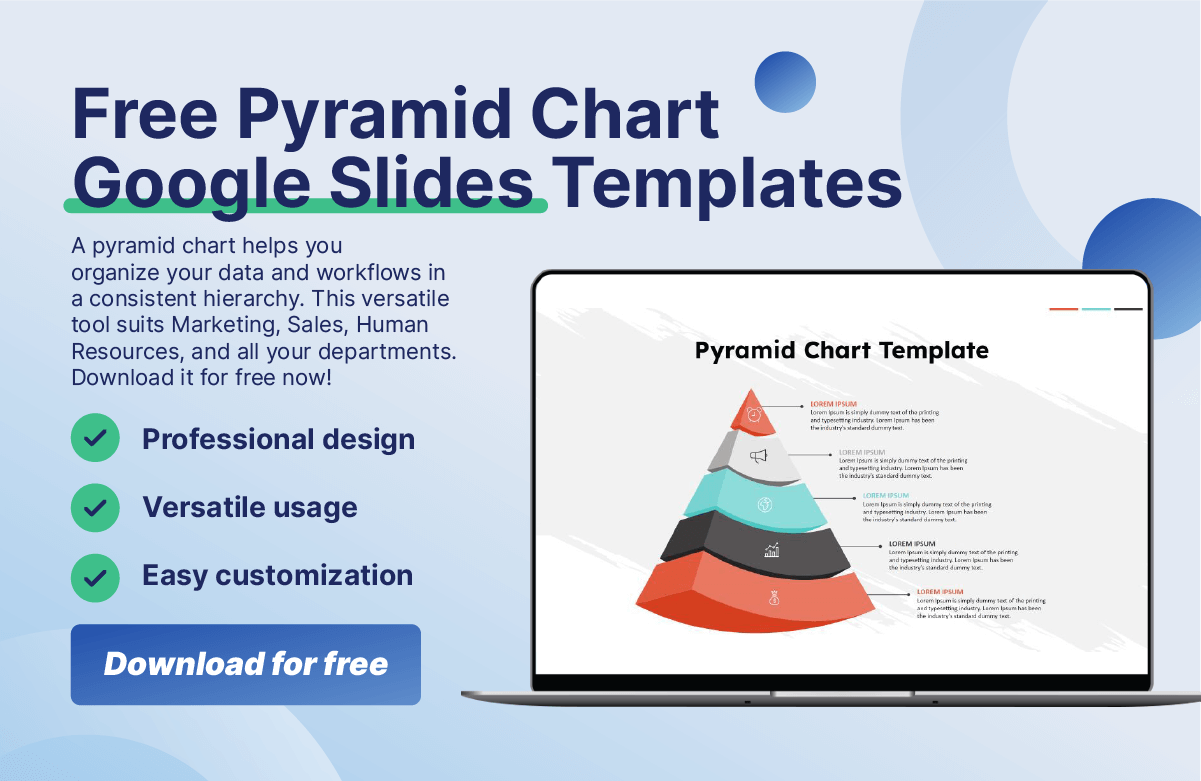
This last template brings you different 3D Pyramid Designs in Google Slides that will give a modern look to your slides. Moreover, you'll find a variety of other charts – all available for free download!
Download our Google Slides Pyramid #5 here.
And there you have it, our detailed guide on how to make a Pyramid Chart in Google Slides!
We're confident that the information provided today will be handy for you to create more eye-catching charts in Google Slides.
If you want to learn how to create a Pyramid Diagram in PowerPoint, we invite you to explore our article and enhance your design skills. Thank us later!

Keep learning with us! Check out this content: